

Key Insights
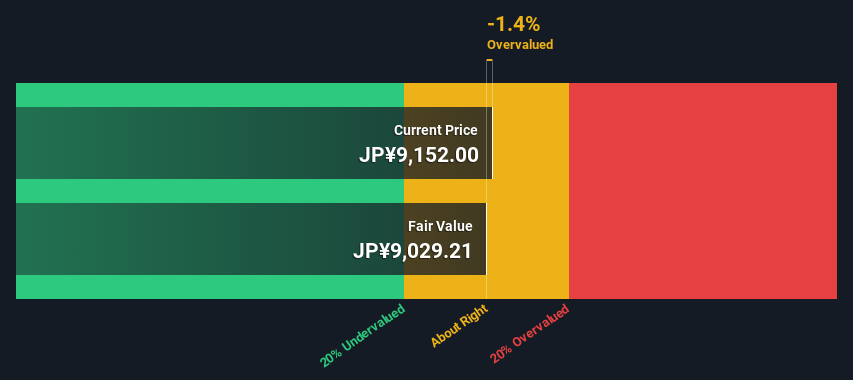
- Fuji Electric's estimated fair value is JP¥9,029 based on 2 Stage Free Cash Flow to Equity
- With JP¥9,152 share price, Fuji Electric appears to be trading close to its estimated fair value
- Analyst price target for 6504 is JP¥10,855, which is 20% above our fair value estimate
Today we'll do a simple run through of a valuation method used to estimate the attractiveness of Fuji Electric Co., Ltd. (TSE:6504) as an investment opportunity by taking the expected future cash flows and discounting them to their present value. This will be done using the Discounted Cash Flow (DCF) model. Models like these may appear beyond the comprehension of a lay person, but they're fairly easy to follow.
Companies can be valued in a lot of ways, so we would point out that a DCF is not perfect for every situation. For those who are keen learners of equity analysis, the Simply Wall St analysis model here may be something of interest to you.
View our latest analysis for Fuji Electric
The Model
We're using the 2-stage growth model, which simply means we take in account two stages of company's growth. In the initial period the company may have a higher growth rate and the second stage is usually assumed to have a stable growth rate. To begin with, we have to get estimates of the next ten years of cash flows. Where possible we use analyst estimates, but when these aren't available we extrapolate the previous free cash flow (FCF) from the last estimate or reported value. We assume companies with shrinking free cash flow will slow their rate of shrinkage, and that companies with growing free cash flow will see their growth rate slow, over this period. We do this to reflect that growth tends to slow more in the early years than it does in later years.
Generally we assume that a dollar today is more valuable than a dollar in the future, and so the sum of these future cash flows is then discounted to today's value:
10-year free cash flow (FCF) estimate
| 2024 | 2025 | 2026 | 2027 | 2028 | 2029 | 2030 | 2031 | 2032 | 2033 | |
| Levered FCF (¥, Millions) | JP¥31.0b | JP¥30.8b | JP¥23.4b | JP¥55.8b | JP¥72.3b | JP¥83.2b | JP¥90.7b | JP¥96.6b | JP¥100.9b | JP¥104.2b |
| Growth Rate Estimate Source | Analyst x4 | Analyst x4 | Analyst x4 | Analyst x4 | Analyst x2 | Analyst x2 | Est @ 9.08% | Est @ 6.41% | Est @ 4.55% | Est @ 3.25% |
| Present Value (¥, Millions) Discounted @ 6.7% | JP¥29.1k | JP¥27.1k | JP¥19.3k | JP¥43.0k | JP¥52.2k | JP¥56.3k | JP¥57.6k | JP¥57.4k | JP¥56.2k | JP¥54.4k |
("Est" = FCF growth rate estimated by Simply Wall St)
Present Value of 10-year Cash Flow (PVCF) = JP¥453b
We now need to calculate the Terminal Value, which accounts for all the future cash flows after this ten year period. The Gordon Growth formula is used to calculate Terminal Value at a future annual growth rate equal to the 5-year average of the 10-year government bond yield of 0.2%. We discount the terminal cash flows to today's value at a cost of equity of 6.7%.
Terminal Value (TV)= FCF2033 × (1 + g) ÷ (r – g) = JP¥104b× (1 + 0.2%) ÷ (6.7%– 0.2%) = JP¥1.6t
Present Value of Terminal Value (PVTV)= TV / (1 + r)10= JP¥1.6t÷ ( 1 + 6.7%)10= JP¥837b
The total value, or equity value, is then the sum of the present value of the future cash flows, which in this case is JP¥1.3t. In the final step we divide the equity value by the number of shares outstanding. Relative to the current share price of JP¥9.2k, the company appears around fair value at the time of writing. The assumptions in any calculation have a big impact on the valuation, so it is better to view this as a rough estimate, not precise down to the last cent.
Important Assumptions
The calculation above is very dependent on two assumptions. The first is the discount rate and the other is the cash flows. You don't have to agree with these inputs, I recommend redoing the calculations yourself and playing with them. The DCF also does not consider the possible cyclicality of an industry, or a company's future capital requirements, so it does not give a full picture of a company's potential performance. Given that we are looking at Fuji Electric as potential shareholders, the cost of equity is used as the discount rate, rather than the cost of capital (or weighted average cost of capital, WACC) which accounts for debt. In this calculation we've used 6.7%, which is based on a levered beta of 1.157. Beta is a measure of a stock's volatility, compared to the market as a whole. We get our beta from the industry average beta of globally comparable companies, with an imposed limit between 0.8 and 2.0, which is a reasonable range for a stable business.
SWOT Analysis for Fuji Electric
- Earnings growth over the past year exceeded its 5-year average.
- Debt is not viewed as a risk.
- Earnings growth over the past year underperformed the Electrical industry.
- Dividend is low compared to the top 25% of dividend payers in the Electrical market.
- Annual earnings are forecast to grow for the next 3 years.
- Good value based on P/E ratio compared to estimated Fair P/E ratio.
- Dividends are not covered by cash flow.
- Annual earnings are forecast to grow slower than the Japanese market.
Moving On:
Whilst important, the DCF calculation is only one of many factors that you need to assess for a company. The DCF model is not a perfect stock valuation tool. Instead the best use for a DCF model is to test certain assumptions and theories to see if they would lead to the company being undervalued or overvalued. If a company grows at a different rate, or if its cost of equity or risk free rate changes sharply, the output can look very different. For Fuji Electric, we've compiled three further elements you should explore:
- Risks: You should be aware of the 1 warning sign for Fuji Electric we've uncovered before considering an investment in the company.
- Future Earnings: How does 6504's growth rate compare to its peers and the wider market? Dig deeper into the analyst consensus number for the upcoming years by interacting with our free analyst growth expectation chart.
- Other Solid Businesses: Low debt, high returns on equity and good past performance are fundamental to a strong business. Why not explore our interactive list of stocks with solid business fundamentals to see if there are other companies you may not have considered!
PS. Simply Wall St updates its DCF calculation for every Japanese stock every day, so if you want to find the intrinsic value of any other stock just search here.
New: AI Stock Screener & Alerts
Our new AI Stock Screener scans the market every day to uncover opportunities.
• Dividend Powerhouses (3%+ Yield)
• Undervalued Small Caps with Insider Buying
• High growth Tech and AI Companies
Or build your own from over 50 metrics.
Have feedback on this article? Concerned about the content? Get in touch with us directly. Alternatively, email editorial-team (at) simplywallst.com.
This article by Simply Wall St is general in nature. We provide commentary based on historical data and analyst forecasts only using an unbiased methodology and our articles are not intended to be financial advice. It does not constitute a recommendation to buy or sell any stock, and does not take account of your objectives, or your financial situation. We aim to bring you long-term focused analysis driven by fundamental data. Note that our analysis may not factor in the latest price-sensitive company announcements or qualitative material. Simply Wall St has no position in any stocks mentioned.
Have feedback on this article? Concerned about the content? Get in touch with us directly. Alternatively, email editorial-team@simplywallst.com
About TSE:6504
Fuji Electric
Develops power semiconductors and electronics solutions in Japan and internationally.
Very undervalued with flawless balance sheet and pays a dividend.
Similar Companies
Market Insights

Community Narratives

