Market Might Still Lack Some Conviction On Okano Valve Mfg.Co.Ltd. (TSE:6492) Even After 27% Share Price Boost


Despite an already strong run, Okano Valve Mfg.Co.Ltd. (TSE:6492) shares have been powering on, with a gain of 27% in the last thirty days. The last 30 days bring the annual gain to a very sharp 53%.
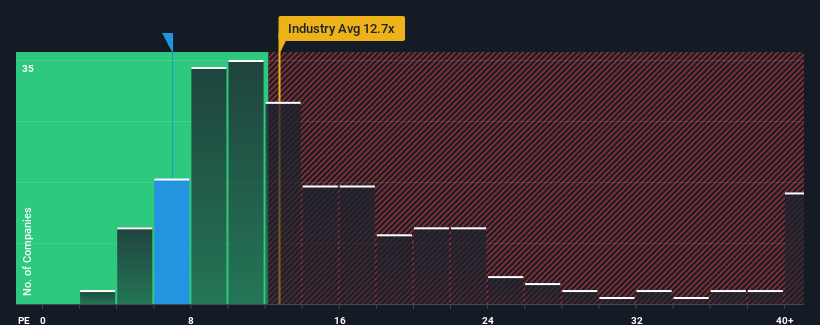
Although its price has surged higher, Okano Valve Mfg.Co.Ltd may still be sending very bullish signals at the moment with its price-to-earnings (or "P/E") ratio of 7x, since almost half of all companies in Japan have P/E ratios greater than 15x and even P/E's higher than 24x are not unusual. However, the P/E might be quite low for a reason and it requires further investigation to determine if it's justified.
Okano Valve Mfg.Co.Ltd certainly has been doing a great job lately as it's been growing earnings at a really rapid pace. It might be that many expect the strong earnings performance to degrade substantially, which has repressed the P/E. If you like the company, you'd be hoping this isn't the case so that you could potentially pick up some stock while it's out of favour.
Check out our latest analysis for Okano Valve Mfg.Co.Ltd
Does Growth Match The Low P/E?
Okano Valve Mfg.Co.Ltd's P/E ratio would be typical for a company that's expected to deliver very poor growth or even falling earnings, and importantly, perform much worse than the market.
Retrospectively, the last year delivered an exceptional 131% gain to the company's bottom line. The strong recent performance means it was also able to grow EPS by 104% in total over the last three years. So we can start by confirming that the company has done a great job of growing earnings over that time.
Comparing that to the market, which is only predicted to deliver 11% growth in the next 12 months, the company's momentum is stronger based on recent medium-term annualised earnings results.
With this information, we find it odd that Okano Valve Mfg.Co.Ltd is trading at a P/E lower than the market. Apparently some shareholders believe the recent performance has exceeded its limits and have been accepting significantly lower selling prices.
What We Can Learn From Okano Valve Mfg.Co.Ltd's P/E?
Even after such a strong price move, Okano Valve Mfg.Co.Ltd's P/E still trails the rest of the market significantly. While the price-to-earnings ratio shouldn't be the defining factor in whether you buy a stock or not, it's quite a capable barometer of earnings expectations.
We've established that Okano Valve Mfg.Co.Ltd currently trades on a much lower than expected P/E since its recent three-year growth is higher than the wider market forecast. When we see strong earnings with faster-than-market growth, we assume potential risks are what might be placing significant pressure on the P/E ratio. At least price risks look to be very low if recent medium-term earnings trends continue, but investors seem to think future earnings could see a lot of volatility.
And what about other risks? Every company has them, and we've spotted 2 warning signs for Okano Valve Mfg.Co.Ltd you should know about.
If P/E ratios interest you, you may wish to see this free collection of other companies with strong earnings growth and low P/E ratios.
If you're looking to trade Okano Valve Mfg.Co.Ltd, open an account with the lowest-cost platform trusted by professionals, Interactive Brokers.
With clients in over 200 countries and territories, and access to 160 markets, IBKR lets you trade stocks, options, futures, forex, bonds and funds from a single integrated account.
Enjoy no hidden fees, no account minimums, and FX conversion rates as low as 0.03%, far better than what most brokers offer.
Sponsored ContentNew: AI Stock Screener & Alerts
Our new AI Stock Screener scans the market every day to uncover opportunities.
• Dividend Powerhouses (3%+ Yield)
• Undervalued Small Caps with Insider Buying
• High growth Tech and AI Companies
Or build your own from over 50 metrics.
Have feedback on this article? Concerned about the content? Get in touch with us directly. Alternatively, email editorial-team (at) simplywallst.com.
This article by Simply Wall St is general in nature. We provide commentary based on historical data and analyst forecasts only using an unbiased methodology and our articles are not intended to be financial advice. It does not constitute a recommendation to buy or sell any stock, and does not take account of your objectives, or your financial situation. We aim to bring you long-term focused analysis driven by fundamental data. Note that our analysis may not factor in the latest price-sensitive company announcements or qualitative material. Simply Wall St has no position in any stocks mentioned.
About TSE:6492
Okano Valve Mfg.Co.Ltd
Manufactures and sells industrial valve for high pressure and high temperature services in Japan.
Flawless balance sheet and good value.
Market Insights

Community Narratives

