

NTN (TSE:6472) Full Year 2025 Results
Key Financial Results
- Revenue: JP¥825.6b (down 1.3% from FY 2024).
- Net loss: JP¥23.8b (down by 325% from JP¥10.6b profit in FY 2024).
- JP¥44.90 loss per share (down from JP¥19.90 profit in FY 2024).
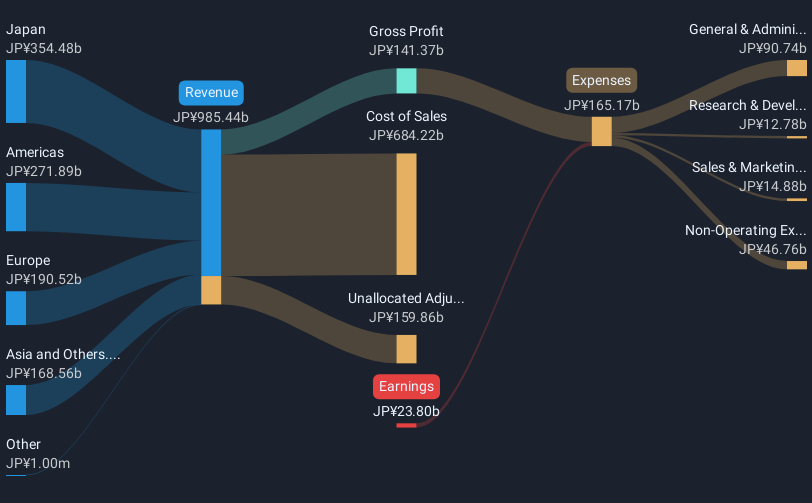
All figures shown in the chart above are for the trailing 12 month (TTM) period
NTN EPS Misses Expectations
Revenue was in line with analyst estimates. Earnings per share (EPS) missed analyst estimates by 82%.
The primary driver behind last 12 months revenue was the Japan segment contributing a total revenue of JP¥354.5b (43% of total revenue). Notably, cost of sales worth JP¥684.2b amounted to 83% of total revenue thereby underscoring the impact on earnings. The largest operating expense was General & Administrative costs, amounting to JP¥90.7b (55% of total expenses). Explore how 6472's revenue and expenses shape its earnings.
Looking ahead, revenue is forecast to stay flat during the next 2 years compared to a 4.4% growth forecast for the Machinery industry in Japan.
Performance of the Japanese Machinery industry.
The company's shares are up 2.0% from a week ago.
Risk Analysis
It is worth noting though that we have found 2 warning signs for NTN (1 doesn't sit too well with us!) that you need to take into consideration.
If you're looking to trade NTN, open an account with the lowest-cost platform trusted by professionals, Interactive Brokers.
With clients in over 200 countries and territories, and access to 160 markets, IBKR lets you trade stocks, options, futures, forex, bonds and funds from a single integrated account.
Enjoy no hidden fees, no account minimums, and FX conversion rates as low as 0.03%, far better than what most brokers offer.
Sponsored ContentValuation is complex, but we're here to simplify it.
Discover if NTN might be undervalued or overvalued with our detailed analysis, featuring fair value estimates, potential risks, dividends, insider trades, and its financial condition.
Access Free AnalysisHave feedback on this article? Concerned about the content? Get in touch with us directly. Alternatively, email editorial-team (at) simplywallst.com.
This article by Simply Wall St is general in nature. We provide commentary based on historical data and analyst forecasts only using an unbiased methodology and our articles are not intended to be financial advice. It does not constitute a recommendation to buy or sell any stock, and does not take account of your objectives, or your financial situation. We aim to bring you long-term focused analysis driven by fundamental data. Note that our analysis may not factor in the latest price-sensitive company announcements or qualitative material. Simply Wall St has no position in any stocks mentioned.
About TSE:6472
NTN
Engages in the manufacture and sale of bearings, drive shafts, and precision equipment and other products in Japan and internationally.
Undervalued with adequate balance sheet and pays a dividend.
Similar Companies
Market Insights

Community Narratives


