

Warren Buffett famously said, 'Volatility is far from synonymous with risk.' When we think about how risky a company is, we always like to look at its use of debt, since debt overload can lead to ruin. We note that Yamada Corporation (TSE:6392) does have debt on its balance sheet. But is this debt a concern to shareholders?
Why Does Debt Bring Risk?
Debt assists a business until the business has trouble paying it off, either with new capital or with free cash flow. Ultimately, if the company can't fulfill its legal obligations to repay debt, shareholders could walk away with nothing. While that is not too common, we often do see indebted companies permanently diluting shareholders because lenders force them to raise capital at a distressed price. Of course, the upside of debt is that it often represents cheap capital, especially when it replaces dilution in a company with the ability to reinvest at high rates of return. When we think about a company's use of debt, we first look at cash and debt together.
View our latest analysis for Yamada
What Is Yamada's Net Debt?
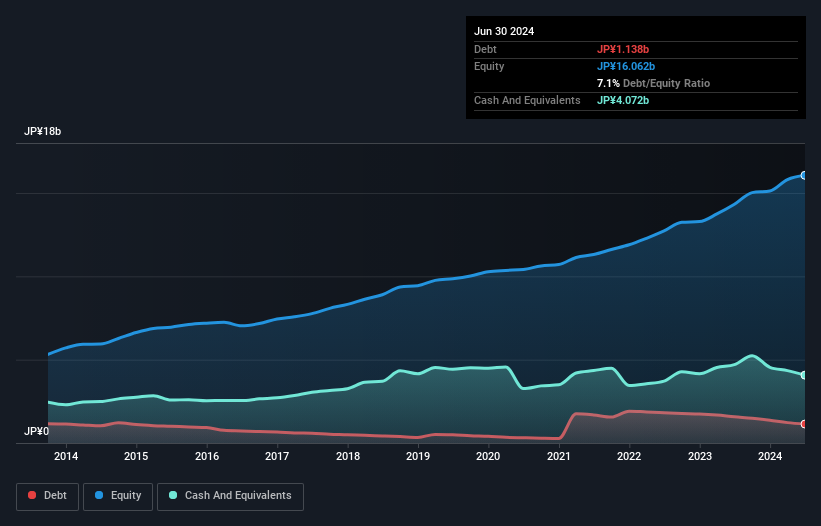
You can click the graphic below for the historical numbers, but it shows that Yamada had JP¥1.14b of debt in June 2024, down from JP¥1.57b, one year before. But on the other hand it also has JP¥4.07b in cash, leading to a JP¥2.93b net cash position.
A Look At Yamada's Liabilities
Zooming in on the latest balance sheet data, we can see that Yamada had liabilities of JP¥1.59b due within 12 months and liabilities of JP¥1.31b due beyond that. Offsetting this, it had JP¥4.07b in cash and JP¥2.04b in receivables that were due within 12 months. So it can boast JP¥3.21b more liquid assets than total liabilities.
This surplus suggests that Yamada is using debt in a way that is appears to be both safe and conservative. Due to its strong net asset position, it is not likely to face issues with its lenders. Succinctly put, Yamada boasts net cash, so it's fair to say it does not have a heavy debt load!
Fortunately, Yamada grew its EBIT by 9.7% in the last year, making that debt load look even more manageable. There's no doubt that we learn most about debt from the balance sheet. But you can't view debt in total isolation; since Yamada will need earnings to service that debt. So if you're keen to discover more about its earnings, it might be worth checking out this graph of its long term earnings trend.
Finally, a business needs free cash flow to pay off debt; accounting profits just don't cut it. Yamada may have net cash on the balance sheet, but it is still interesting to look at how well the business converts its earnings before interest and tax (EBIT) to free cash flow, because that will influence both its need for, and its capacity to manage debt. In the last three years, Yamada created free cash flow amounting to 16% of its EBIT, an uninspiring performance. For us, cash conversion that low sparks a little paranoia about is ability to extinguish debt.
Summing Up
While we empathize with investors who find debt concerning, you should keep in mind that Yamada has net cash of JP¥2.93b, as well as more liquid assets than liabilities. On top of that, it increased its EBIT by 9.7% in the last twelve months. So we don't think Yamada's use of debt is risky. There's no doubt that we learn most about debt from the balance sheet. But ultimately, every company can contain risks that exist outside of the balance sheet. For example, we've discovered 2 warning signs for Yamada that you should be aware of before investing here.
At the end of the day, it's often better to focus on companies that are free from net debt. You can access our special list of such companies (all with a track record of profit growth). It's free.
If you're looking to trade Yamada, open an account with the lowest-cost platform trusted by professionals, Interactive Brokers.
With clients in over 200 countries and territories, and access to 160 markets, IBKR lets you trade stocks, options, futures, forex, bonds and funds from a single integrated account.
Enjoy no hidden fees, no account minimums, and FX conversion rates as low as 0.03%, far better than what most brokers offer.
Sponsored ContentNew: Manage All Your Stock Portfolios in One Place
We've created the ultimate portfolio companion for stock investors, and it's free.
• Connect an unlimited number of Portfolios and see your total in one currency
• Be alerted to new Warning Signs or Risks via email or mobile
• Track the Fair Value of your stocks
Have feedback on this article? Concerned about the content? Get in touch with us directly. Alternatively, email editorial-team (at) simplywallst.com.
This article by Simply Wall St is general in nature. We provide commentary based on historical data and analyst forecasts only using an unbiased methodology and our articles are not intended to be financial advice. It does not constitute a recommendation to buy or sell any stock, and does not take account of your objectives, or your financial situation. We aim to bring you long-term focused analysis driven by fundamental data. Note that our analysis may not factor in the latest price-sensitive company announcements or qualitative material. Simply Wall St has no position in any stocks mentioned.
About TSE:6392
Yamada
Engages in the manufacture and sale of industrial and automotive equipment in Japan and internationally.
6 star dividend payer with excellent balance sheet.
Market Insights

Community Narratives


