
Advertisement
Estimating The Intrinsic Value Of Harmonic Drive Systems Inc. (TSE:6324)
Key Insights
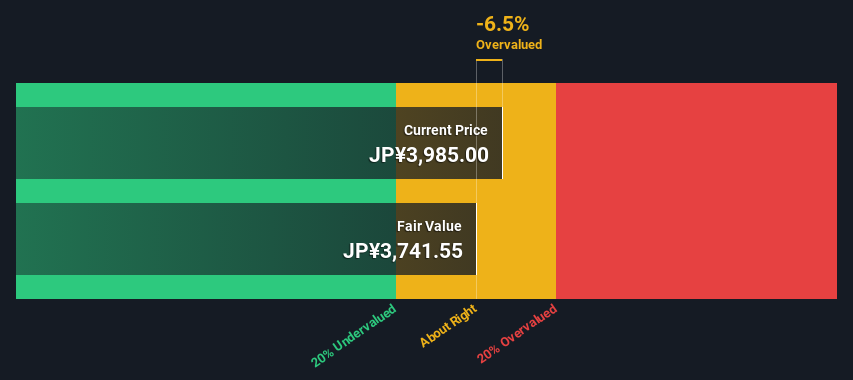
- Harmonic Drive Systems' estimated fair value is JP¥3,742 based on 2 Stage Free Cash Flow to Equity
- Current share price of JP¥3,985 suggests Harmonic Drive Systems is potentially trading close to its fair value
- The JP¥4,584 analyst price target for 6324 is 23% more than our estimate of fair value
How far off is Harmonic Drive Systems Inc. (TSE:6324) from its intrinsic value? Using the most recent financial data, we'll take a look at whether the stock is fairly priced by taking the expected future cash flows and discounting them to today's value. This will be done using the Discounted Cash Flow (DCF) model. Don't get put off by the jargon, the math behind it is actually quite straightforward.
We would caution that there are many ways of valuing a company and, like the DCF, each technique has advantages and disadvantages in certain scenarios. Anyone interested in learning a bit more about intrinsic value should have a read of the Simply Wall St analysis model.
See our latest analysis for Harmonic Drive Systems
The Model
We're using the 2-stage growth model, which simply means we take in account two stages of company's growth. In the initial period the company may have a higher growth rate and the second stage is usually assumed to have a stable growth rate. In the first stage we need to estimate the cash flows to the business over the next ten years. Where possible we use analyst estimates, but when these aren't available we extrapolate the previous free cash flow (FCF) from the last estimate or reported value. We assume companies with shrinking free cash flow will slow their rate of shrinkage, and that companies with growing free cash flow will see their growth rate slow, over this period. We do this to reflect that growth tends to slow more in the early years than it does in later years.
Generally we assume that a dollar today is more valuable than a dollar in the future, so we discount the value of these future cash flows to their estimated value in today's dollars:
10-year free cash flow (FCF) estimate
| 2024 | 2025 | 2026 | 2027 | 2028 | 2029 | 2030 | 2031 | 2032 | 2033 | |
| Levered FCF (¥, Millions) | JP¥8.26b | JP¥5.32b | JP¥7.20b | JP¥12.6b | JP¥16.5b | JP¥19.4b | JP¥21.7b | JP¥23.6b | JP¥25.0b | JP¥26.1b |
| Growth Rate Estimate Source | Analyst x3 | Analyst x3 | Analyst x3 | Analyst x3 | Analyst x3 | Est @ 17.28% | Est @ 12.14% | Est @ 8.55% | Est @ 6.03% | Est @ 4.27% |
| Present Value (¥, Millions) Discounted @ 6.1% | JP¥7.8k | JP¥4.7k | JP¥6.0k | JP¥10.0k | JP¥12.3k | JP¥13.6k | JP¥14.3k | JP¥14.7k | JP¥14.7k | JP¥14.4k |
("Est" = FCF growth rate estimated by Simply Wall St)
Present Value of 10-year Cash Flow (PVCF) = JP¥112b
After calculating the present value of future cash flows in the initial 10-year period, we need to calculate the Terminal Value, which accounts for all future cash flows beyond the first stage. For a number of reasons a very conservative growth rate is used that cannot exceed that of a country's GDP growth. In this case we have used the 5-year average of the 10-year government bond yield (0.2%) to estimate future growth. In the same way as with the 10-year 'growth' period, we discount future cash flows to today's value, using a cost of equity of 6.1%.
Terminal Value (TV)= FCF2033 × (1 + g) ÷ (r – g) = JP¥26b× (1 + 0.2%) ÷ (6.1%– 0.2%) = JP¥439b
Present Value of Terminal Value (PVTV)= TV / (1 + r)10= JP¥439b÷ ( 1 + 6.1%)10= JP¥243b
The total value, or equity value, is then the sum of the present value of the future cash flows, which in this case is JP¥355b. The last step is to then divide the equity value by the number of shares outstanding. Relative to the current share price of JP¥4.0k, the company appears around fair value at the time of writing. Valuations are imprecise instruments though, rather like a telescope - move a few degrees and end up in a different galaxy. Do keep this in mind.
The Assumptions
Now the most important inputs to a discounted cash flow are the discount rate, and of course, the actual cash flows. If you don't agree with these result, have a go at the calculation yourself and play with the assumptions. The DCF also does not consider the possible cyclicality of an industry, or a company's future capital requirements, so it does not give a full picture of a company's potential performance. Given that we are looking at Harmonic Drive Systems as potential shareholders, the cost of equity is used as the discount rate, rather than the cost of capital (or weighted average cost of capital, WACC) which accounts for debt. In this calculation we've used 6.1%, which is based on a levered beta of 1.056. Beta is a measure of a stock's volatility, compared to the market as a whole. We get our beta from the industry average beta of globally comparable companies, with an imposed limit between 0.8 and 2.0, which is a reasonable range for a stable business.
SWOT Analysis for Harmonic Drive Systems
Strength
- Debt is not viewed as a risk.
Weakness
- Earnings declined over the past year.
- Dividend is low compared to the top 25% of dividend payers in the Machinery market.
- Expensive based on P/S ratio and estimated fair value.
Opportunity
- Annual earnings are forecast to grow faster than the Japanese market.
Threat
- Revenue is forecast to grow slower than 20% per year.
Looking Ahead:
Although the valuation of a company is important, it shouldn't be the only metric you look at when researching a company. It's not possible to obtain a foolproof valuation with a DCF model. Preferably you'd apply different cases and assumptions and see how they would impact the company's valuation. If a company grows at a different rate, or if its cost of equity or risk free rate changes sharply, the output can look very different. For Harmonic Drive Systems, we've put together three relevant items you should look at:
- Risks: Consider for instance, the ever-present spectre of investment risk. We've identified 2 warning signs with Harmonic Drive Systems , and understanding these should be part of your investment process.
- Future Earnings: How does 6324's growth rate compare to its peers and the wider market? Dig deeper into the analyst consensus number for the upcoming years by interacting with our free analyst growth expectation chart.
- Other High Quality Alternatives: Do you like a good all-rounder? Explore our interactive list of high quality stocks to get an idea of what else is out there you may be missing!
PS. Simply Wall St updates its DCF calculation for every Japanese stock every day, so if you want to find the intrinsic value of any other stock just search here.
Valuation is complex, but we're here to simplify it.
Discover if Harmonic Drive Systems might be undervalued or overvalued with our detailed analysis, featuring fair value estimates, potential risks, dividends, insider trades, and its financial condition.
Access Free AnalysisHave feedback on this article? Concerned about the content? Get in touch with us directly. Alternatively, email editorial-team (at) simplywallst.com.
This article by Simply Wall St is general in nature. We provide commentary based on historical data and analyst forecasts only using an unbiased methodology and our articles are not intended to be financial advice. It does not constitute a recommendation to buy or sell any stock, and does not take account of your objectives, or your financial situation. We aim to bring you long-term focused analysis driven by fundamental data. Note that our analysis may not factor in the latest price-sensitive company announcements or qualitative material. Simply Wall St has no position in any stocks mentioned.
About TSE:6324
Harmonic Drive Systems
Produces and sells precision control equipment and components worldwide.
Excellent balance sheet with reasonable growth potential.
Similar Companies
Market Insights

Advertisement
Community Narratives
The Next Phase of Energy Storage: How NeoVolta Is Tackling America’s Power Crunch
Fair Value US$7.50|35.2% undervalued
MA
Community Contributor
Why EnSilica is Worth Possibly 13x its Current Price
Fair Value UK£5.00|90.0% undervalued
DO
Community Contributor
M&A Activity, Industry Diversification & A Defense Contract Monopoly Will Push BWXT For Healthy Long-Term Growth
Fair Value US$220.00|15.6% undervalued
CL
Community Contributor
A case for Cassiar Gold Corp (TSXV: GLDC) to reach CAD$8-10 before 2030 (X30-37)
Fair Value CA$10.00|97.1% undervalued
AG
Community Contributor