Toyota Industries (TSE:6201) Has A Pretty Healthy Balance Sheet


Legendary fund manager Li Lu (who Charlie Munger backed) once said, 'The biggest investment risk is not the volatility of prices, but whether you will suffer a permanent loss of capital.' So it seems the smart money knows that debt - which is usually involved in bankruptcies - is a very important factor, when you assess how risky a company is. We can see that Toyota Industries Corporation (TSE:6201) does use debt in its business. But is this debt a concern to shareholders?
When Is Debt A Problem?
Generally speaking, debt only becomes a real problem when a company can't easily pay it off, either by raising capital or with its own cash flow. Part and parcel of capitalism is the process of 'creative destruction' where failed businesses are mercilessly liquidated by their bankers. However, a more common (but still painful) scenario is that it has to raise new equity capital at a low price, thus permanently diluting shareholders. By replacing dilution, though, debt can be an extremely good tool for businesses that need capital to invest in growth at high rates of return. The first step when considering a company's debt levels is to consider its cash and debt together.
Check out our latest analysis for Toyota Industries
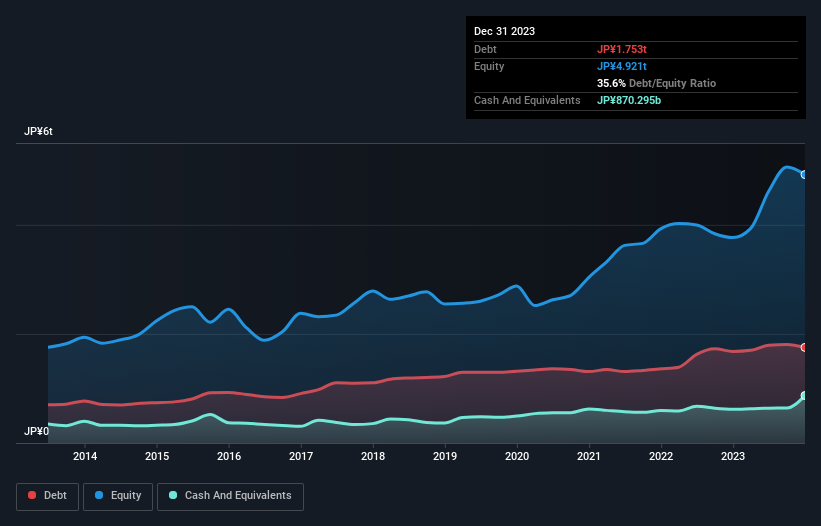
What Is Toyota Industries's Net Debt?
You can click the graphic below for the historical numbers, but it shows that as of December 2023 Toyota Industries had JP¥1.75t of debt, an increase on JP¥1.68t, over one year. On the flip side, it has JP¥870.3b in cash leading to net debt of about JP¥882.5b.
How Strong Is Toyota Industries' Balance Sheet?
We can see from the most recent balance sheet that Toyota Industries had liabilities of JP¥1.54t falling due within a year, and liabilities of JP¥2.78t due beyond that. Offsetting this, it had JP¥870.3b in cash and JP¥1.54t in receivables that were due within 12 months. So its liabilities total JP¥1.91t more than the combination of its cash and short-term receivables.
This deficit isn't so bad because Toyota Industries is worth a massive JP¥4.29t, and thus could probably raise enough capital to shore up its balance sheet, if the need arose. But we definitely want to keep our eyes open to indications that its debt is bringing too much risk.
We measure a company's debt load relative to its earnings power by looking at its net debt divided by its earnings before interest, tax, depreciation, and amortization (EBITDA) and by calculating how easily its earnings before interest and tax (EBIT) cover its interest expense (interest cover). Thus we consider debt relative to earnings both with and without depreciation and amortization expenses.
Toyota Industries's net debt to EBITDA ratio of about 1.7 suggests only moderate use of debt. And its commanding EBIT of 1k times its interest expense, implies the debt load is as light as a peacock feather. Importantly, Toyota Industries grew its EBIT by 43% over the last twelve months, and that growth will make it easier to handle its debt. There's no doubt that we learn most about debt from the balance sheet. But ultimately the future profitability of the business will decide if Toyota Industries can strengthen its balance sheet over time. So if you want to see what the professionals think, you might find this free report on analyst profit forecasts to be interesting.
Finally, a business needs free cash flow to pay off debt; accounting profits just don't cut it. So we clearly need to look at whether that EBIT is leading to corresponding free cash flow. Over the last three years, Toyota Industries reported free cash flow worth 12% of its EBIT, which is really quite low. That limp level of cash conversion undermines its ability to manage and pay down debt.
Our View
Both Toyota Industries's ability to to cover its interest expense with its EBIT and its EBIT growth rate gave us comfort that it can handle its debt. Having said that, its conversion of EBIT to free cash flow somewhat sensitizes us to potential future risks to the balance sheet. Considering this range of data points, we think Toyota Industries is in a good position to manage its debt levels. Having said that, the load is sufficiently heavy that we would recommend any shareholders keep a close eye on it. Over time, share prices tend to follow earnings per share, so if you're interested in Toyota Industries, you may well want to click here to check an interactive graph of its earnings per share history.
If, after all that, you're more interested in a fast growing company with a rock-solid balance sheet, then check out our list of net cash growth stocks without delay.
Valuation is complex, but we're here to simplify it.
Discover if Toyota Industries might be undervalued or overvalued with our detailed analysis, featuring fair value estimates, potential risks, dividends, insider trades, and its financial condition.
Access Free AnalysisHave feedback on this article? Concerned about the content? Get in touch with us directly. Alternatively, email editorial-team (at) simplywallst.com.
This article by Simply Wall St is general in nature. We provide commentary based on historical data and analyst forecasts only using an unbiased methodology and our articles are not intended to be financial advice. It does not constitute a recommendation to buy or sell any stock, and does not take account of your objectives, or your financial situation. We aim to bring you long-term focused analysis driven by fundamental data. Note that our analysis may not factor in the latest price-sensitive company announcements or qualitative material. Simply Wall St has no position in any stocks mentioned.
About TSE:6201
Toyota Industries
Manufactures and sells textiles machinery, materials handling equipment, automobiles, and automobile parts in Japan, the United States, and internationally.
Excellent balance sheet average dividend payer.
Similar Companies
Market Insights

Community Narratives

