Interested In Amada's (TSE:6113) Upcoming JP¥31.00 Dividend? You Have Three Days Left

It looks like Amada Co., Ltd. (TSE:6113) is about to go ex-dividend in the next 3 days. Typically, the ex-dividend date is one business day before the record date which is the date on which a company determines the shareholders eligible to receive a dividend. The ex-dividend date is an important date to be aware of as any purchase of the stock made on or after this date might mean a late settlement that doesn't show on the record date. This means that investors who purchase Amada's shares on or after the 27th of September will not receive the dividend, which will be paid on the 5th of December.
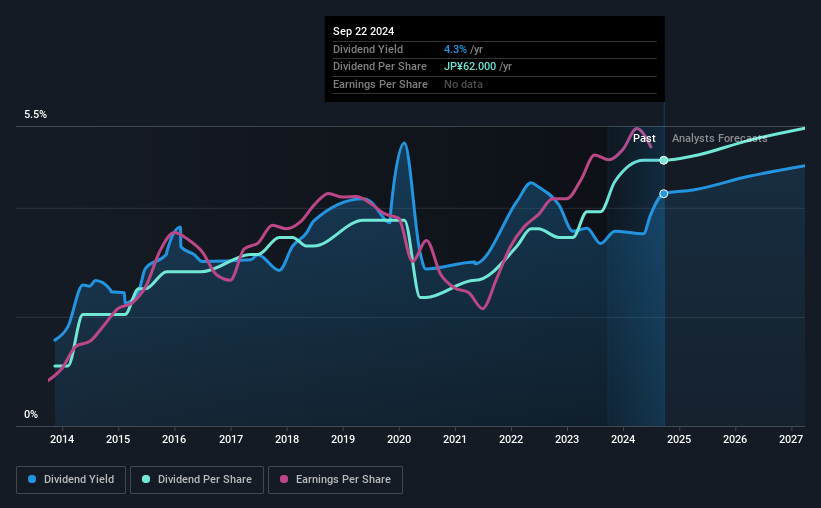
The company's next dividend payment will be JP¥31.00 per share. Last year, in total, the company distributed JP¥62.00 to shareholders. Last year's total dividend payments show that Amada has a trailing yield of 4.3% on the current share price of JP¥1456.00. Dividends are an important source of income to many shareholders, but the health of the business is crucial to maintaining those dividends. So we need to investigate whether Amada can afford its dividend, and if the dividend could grow.
Check out our latest analysis for Amada
Dividends are typically paid out of company income, so if a company pays out more than it earned, its dividend is usually at a higher risk of being cut. Amada paid out 54% of its earnings to investors last year, a normal payout level for most businesses. Yet cash flow is typically more important than profit for assessing dividend sustainability, so we should always check if the company generated enough cash to afford its dividend. Over the last year it paid out 50% of its free cash flow as dividends, within the usual range for most companies.
It's positive to see that Amada's dividend is covered by both profits and cash flow, since this is generally a sign that the dividend is sustainable, and a lower payout ratio usually suggests a greater margin of safety before the dividend gets cut.
Click here to see the company's payout ratio, plus analyst estimates of its future dividends.

Have Earnings And Dividends Been Growing?
Companies with consistently growing earnings per share generally make the best dividend stocks, as they usually find it easier to grow dividends per share. If earnings decline and the company is forced to cut its dividend, investors could watch the value of their investment go up in smoke. This is why it's a relief to see Amada earnings per share are up 4.4% per annum over the last five years. Earnings per share growth has been slim, and the company is already paying out a majority of its earnings. While there is some room to both increase the payout ratio and reinvest in the business, generally the higher a payout ratio goes, the lower a company's prospects for future growth.
The main way most investors will assess a company's dividend prospects is by checking the historical rate of dividend growth. In the last 10 years, Amada has lifted its dividend by approximately 16% a year on average. We're glad to see dividends rising alongside earnings over a number of years, which may be a sign the company intends to share the growth with shareholders.
Final Takeaway
Has Amada got what it takes to maintain its dividend payments? Earnings per share have been growing modestly and Amada paid out a bit over half of its earnings and free cash flow last year. In summary, it's hard to get excited about Amada from a dividend perspective.
With that being said, if dividends aren't your biggest concern with Amada, you should know about the other risks facing this business. Case in point: We've spotted 2 warning signs for Amada you should be aware of.
Generally, we wouldn't recommend just buying the first dividend stock you see. Here's a curated list of interesting stocks that are strong dividend payers.
New: Manage All Your Stock Portfolios in One Place
We've created the ultimate portfolio companion for stock investors, and it's free.
• Connect an unlimited number of Portfolios and see your total in one currency
• Be alerted to new Warning Signs or Risks via email or mobile
• Track the Fair Value of your stocks
Have feedback on this article? Concerned about the content? Get in touch with us directly. Alternatively, email editorial-team (at) simplywallst.com.
This article by Simply Wall St is general in nature. We provide commentary based on historical data and analyst forecasts only using an unbiased methodology and our articles are not intended to be financial advice. It does not constitute a recommendation to buy or sell any stock, and does not take account of your objectives, or your financial situation. We aim to bring you long-term focused analysis driven by fundamental data. Note that our analysis may not factor in the latest price-sensitive company announcements or qualitative material. Simply Wall St has no position in any stocks mentioned.
About TSE:6113
Amada
Manufactures, sells, leases, repairs, maintains, checks, and inspects metalworking machinery, software, and peripheral equipment in Japan, North America, Europe, Asia, and internationally.
Flawless balance sheet, undervalued and pays a dividend.
Similar Companies
Market Insights
Community Narratives


