
Advertisement
The external fund manager backed by Berkshire Hathaway's Charlie Munger, Li Lu, makes no bones about it when he says 'The biggest investment risk is not the volatility of prices, but whether you will suffer a permanent loss of capital.' So it might be obvious that you need to consider debt, when you think about how risky any given stock is, because too much debt can sink a company. Importantly, Okuma Corporation (TSE:6103) does carry debt. But the more important question is: how much risk is that debt creating?
When Is Debt Dangerous?
Debt is a tool to help businesses grow, but if a business is incapable of paying off its lenders, then it exists at their mercy. If things get really bad, the lenders can take control of the business. However, a more usual (but still expensive) situation is where a company must dilute shareholders at a cheap share price simply to get debt under control. Of course, plenty of companies use debt to fund growth, without any negative consequences. When we examine debt levels, we first consider both cash and debt levels, together.
Check out our latest analysis for Okuma
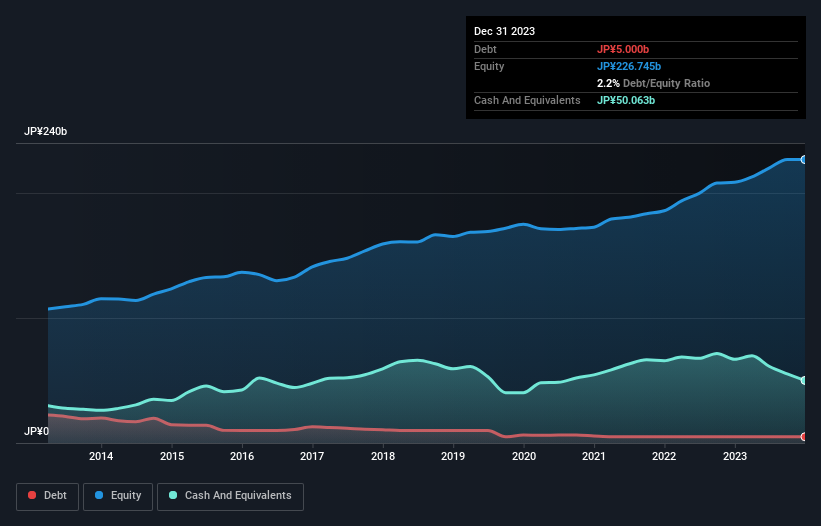
What Is Okuma's Net Debt?
As you can see below, Okuma had JP¥5.00b of debt, at December 2023, which is about the same as the year before. You can click the chart for greater detail. However, it does have JP¥50.1b in cash offsetting this, leading to net cash of JP¥45.1b.
How Healthy Is Okuma's Balance Sheet?
Zooming in on the latest balance sheet data, we can see that Okuma had liabilities of JP¥50.9b due within 12 months and liabilities of JP¥9.55b due beyond that. On the other hand, it had cash of JP¥50.1b and JP¥38.6b worth of receivables due within a year. So it can boast JP¥28.3b more liquid assets than total liabilities.
This surplus suggests that Okuma has a conservative balance sheet, and could probably eliminate its debt without much difficulty. Succinctly put, Okuma boasts net cash, so it's fair to say it does not have a heavy debt load!
And we also note warmly that Okuma grew its EBIT by 11% last year, making its debt load easier to handle. When analysing debt levels, the balance sheet is the obvious place to start. But ultimately the future profitability of the business will decide if Okuma can strengthen its balance sheet over time. So if you're focused on the future you can check out this free report showing analyst profit forecasts.
Finally, a company can only pay off debt with cold hard cash, not accounting profits. While Okuma has net cash on its balance sheet, it's still worth taking a look at its ability to convert earnings before interest and tax (EBIT) to free cash flow, to help us understand how quickly it is building (or eroding) that cash balance. In the last three years, Okuma created free cash flow amounting to 17% of its EBIT, an uninspiring performance. For us, cash conversion that low sparks a little paranoia about is ability to extinguish debt.
Summing Up
While we empathize with investors who find debt concerning, you should keep in mind that Okuma has net cash of JP¥45.1b, as well as more liquid assets than liabilities. And it also grew its EBIT by 11% over the last year. So we are not troubled with Okuma's debt use. When analysing debt levels, the balance sheet is the obvious place to start. But ultimately, every company can contain risks that exist outside of the balance sheet. For example - Okuma has 1 warning sign we think you should be aware of.
Of course, if you're the type of investor who prefers buying stocks without the burden of debt, then don't hesitate to discover our exclusive list of net cash growth stocks, today.
New: AI Stock Screener & Alerts
Our new AI Stock Screener scans the market every day to uncover opportunities.
• Dividend Powerhouses (3%+ Yield)
• Undervalued Small Caps with Insider Buying
• High growth Tech and AI Companies
Or build your own from over 50 metrics.
Have feedback on this article? Concerned about the content? Get in touch with us directly. Alternatively, email editorial-team (at) simplywallst.com.
This article by Simply Wall St is general in nature. We provide commentary based on historical data and analyst forecasts only using an unbiased methodology and our articles are not intended to be financial advice. It does not constitute a recommendation to buy or sell any stock, and does not take account of your objectives, or your financial situation. We aim to bring you long-term focused analysis driven by fundamental data. Note that our analysis may not factor in the latest price-sensitive company announcements or qualitative material. Simply Wall St has no position in any stocks mentioned.
About TSE:6103
Okuma
Manufactures and sells machine tools in Japan, the United States, Europe, and Asia/Pacific.
Excellent balance sheet with moderate growth potential.
Similar Companies
Market Insights

Advertisement
Community Narratives
Quality at a Premium. A time to watch, not to buy?
Fair Value US$154.56|30.1% undervalued
DA
Community Contributor
GRAB: The Super-App at the Heart of Southeast Asia’s Digital Boom
Fair Value US$8.20|25.6% undervalued
BL
Community Contributor
Verve Group to Surge with 51.61% Revenue Growth
Fair Value €6.00|63.2% undervalued
ME
Community Contributor