
Advertisement

Warren Buffett famously said, 'Volatility is far from synonymous with risk.' So it might be obvious that you need to consider debt, when you think about how risky any given stock is, because too much debt can sink a company. As with many other companies TriIs Incorporated (TSE:4840) makes use of debt. But the real question is whether this debt is making the company risky.
When Is Debt Dangerous?
Debt assists a business until the business has trouble paying it off, either with new capital or with free cash flow. Part and parcel of capitalism is the process of 'creative destruction' where failed businesses are mercilessly liquidated by their bankers. However, a more usual (but still expensive) situation is where a company must dilute shareholders at a cheap share price simply to get debt under control. Having said that, the most common situation is where a company manages its debt reasonably well - and to its own advantage. The first thing to do when considering how much debt a business uses is to look at its cash and debt together.
See our latest analysis for TriIs
How Much Debt Does TriIs Carry?
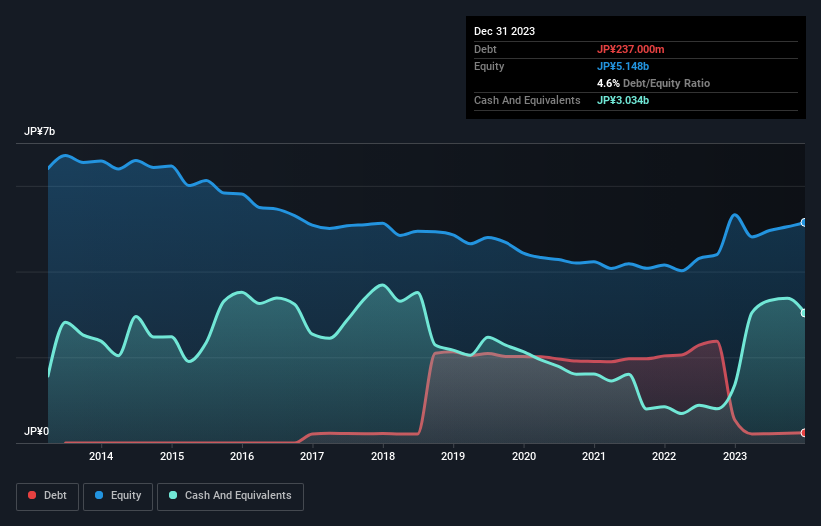
You can click the graphic below for the historical numbers, but it shows that TriIs had JP¥237.0m of debt in December 2023, down from JP¥541.0m, one year before. However, its balance sheet shows it holds JP¥3.03b in cash, so it actually has JP¥2.80b net cash.
How Strong Is TriIs' Balance Sheet?
The latest balance sheet data shows that TriIs had liabilities of JP¥209.0m due within a year, and liabilities of JP¥243.0m falling due after that. On the other hand, it had cash of JP¥3.03b and JP¥56.0m worth of receivables due within a year. So it actually has JP¥2.64b more liquid assets than total liabilities.
This excess liquidity is a great indication that TriIs' balance sheet is almost as strong as Fort Knox. Having regard to this fact, we think its balance sheet is as strong as an ox. Succinctly put, TriIs boasts net cash, so it's fair to say it does not have a heavy debt load! There's no doubt that we learn most about debt from the balance sheet. But you can't view debt in total isolation; since TriIs will need earnings to service that debt. So when considering debt, it's definitely worth looking at the earnings trend. Click here for an interactive snapshot.
In the last year TriIs had a loss before interest and tax, and actually shrunk its revenue by 12%, to JP¥636m. We would much prefer see growth.
So How Risky Is TriIs?
Although TriIs had an earnings before interest and tax (EBIT) loss over the last twelve months, it made a statutory profit of JP¥102m. So when you consider it has net cash, along with the statutory profit, the stock probably isn't as risky as it might seem, at least in the short term. There's no doubt the next few years will be crucial to how the business matures. The balance sheet is clearly the area to focus on when you are analysing debt. However, not all investment risk resides within the balance sheet - far from it. To that end, you should be aware of the 5 warning signs we've spotted with TriIs .
If you're interested in investing in businesses that can grow profits without the burden of debt, then check out this free list of growing businesses that have net cash on the balance sheet.
Valuation is complex, but we're here to simplify it.
Discover if TriIs might be undervalued or overvalued with our detailed analysis, featuring fair value estimates, potential risks, dividends, insider trades, and its financial condition.
Access Free AnalysisHave feedback on this article? Concerned about the content? Get in touch with us directly. Alternatively, email editorial-team (at) simplywallst.com.
This article by Simply Wall St is general in nature. We provide commentary based on historical data and analyst forecasts only using an unbiased methodology and our articles are not intended to be financial advice. It does not constitute a recommendation to buy or sell any stock, and does not take account of your objectives, or your financial situation. We aim to bring you long-term focused analysis driven by fundamental data. Note that our analysis may not factor in the latest price-sensitive company announcements or qualitative material. Simply Wall St has no position in any stocks mentioned.
About TSE:4840
TriIs
Engages in the construction consulting and fashion businesses in Japan and internationally.
Solid track record with excellent balance sheet.
Market Insights

Advertisement
Community Narratives
Enterprise, AI & Cloud Growth Ahead, Waiting For the Right Price 💸
Fair Value US$204.74|6.7% overvalued
FR
Community Contributor
Good foundation, but now it's all about the next steps
Fair Value US$147.87|23.9% undervalued
TO
Community Contributor
XTB's Path to 100–120 PLN by 2028 Amid Market Volatility
Fair Value zł100.96|33.3% undervalued
DZ
Community Contributor