Investors Could Be Concerned With Takahashi Curtain Wall's (TSE:1994) Returns On Capital


What trends should we look for it we want to identify stocks that can multiply in value over the long term? Firstly, we'll want to see a proven return on capital employed (ROCE) that is increasing, and secondly, an expanding base of capital employed. Basically this means that a company has profitable initiatives that it can continue to reinvest in, which is a trait of a compounding machine. However, after investigating Takahashi Curtain Wall (TSE:1994), we don't think it's current trends fit the mold of a multi-bagger.
Understanding Return On Capital Employed (ROCE)
For those that aren't sure what ROCE is, it measures the amount of pre-tax profits a company can generate from the capital employed in its business. Analysts use this formula to calculate it for Takahashi Curtain Wall:
Return on Capital Employed = Earnings Before Interest and Tax (EBIT) ÷ (Total Assets - Current Liabilities)
0.034 = JP¥377m ÷ (JP¥13b - JP¥1.8b) (Based on the trailing twelve months to March 2024).
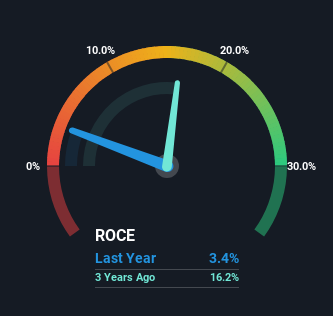
Thus, Takahashi Curtain Wall has an ROCE of 3.4%. Ultimately, that's a low return and it under-performs the Building industry average of 7.5%.
View our latest analysis for Takahashi Curtain Wall
While the past is not representative of the future, it can be helpful to know how a company has performed historically, which is why we have this chart above. If you'd like to look at how Takahashi Curtain Wall has performed in the past in other metrics, you can view this free graph of Takahashi Curtain Wall's past earnings, revenue and cash flow.
So How Is Takahashi Curtain Wall's ROCE Trending?
When we looked at the ROCE trend at Takahashi Curtain Wall, we didn't gain much confidence. Over the last five years, returns on capital have decreased to 3.4% from 9.9% five years ago. However it looks like Takahashi Curtain Wall might be reinvesting for long term growth because while capital employed has increased, the company's sales haven't changed much in the last 12 months. It's worth keeping an eye on the company's earnings from here on to see if these investments do end up contributing to the bottom line.
On a side note, Takahashi Curtain Wall has done well to pay down its current liabilities to 14% of total assets. So we could link some of this to the decrease in ROCE. Effectively this means their suppliers or short-term creditors are funding less of the business, which reduces some elements of risk. Since the business is basically funding more of its operations with it's own money, you could argue this has made the business less efficient at generating ROCE.
The Bottom Line
Bringing it all together, while we're somewhat encouraged by Takahashi Curtain Wall's reinvestment in its own business, we're aware that returns are shrinking. And in the last five years, the stock has given away 14% so the market doesn't look too hopeful on these trends strengthening any time soon. On the whole, we aren't too inspired by the underlying trends and we think there may be better chances of finding a multi-bagger elsewhere.
If you want to know some of the risks facing Takahashi Curtain Wall we've found 3 warning signs (1 makes us a bit uncomfortable!) that you should be aware of before investing here.
For those who like to invest in solid companies, check out this free list of companies with solid balance sheets and high returns on equity.
If you're looking to trade Takahashi Curtain Wall, open an account with the lowest-cost platform trusted by professionals, Interactive Brokers.
With clients in over 200 countries and territories, and access to 160 markets, IBKR lets you trade stocks, options, futures, forex, bonds and funds from a single integrated account.
Enjoy no hidden fees, no account minimums, and FX conversion rates as low as 0.03%, far better than what most brokers offer.
Sponsored ContentValuation is complex, but we're here to simplify it.
Discover if Takahashi Curtain Wall might be undervalued or overvalued with our detailed analysis, featuring fair value estimates, potential risks, dividends, insider trades, and its financial condition.
Access Free AnalysisHave feedback on this article? Concerned about the content? Get in touch with us directly. Alternatively, email editorial-team (at) simplywallst.com.
This article by Simply Wall St is general in nature. We provide commentary based on historical data and analyst forecasts only using an unbiased methodology and our articles are not intended to be financial advice. It does not constitute a recommendation to buy or sell any stock, and does not take account of your objectives, or your financial situation. We aim to bring you long-term focused analysis driven by fundamental data. Note that our analysis may not factor in the latest price-sensitive company announcements or qualitative material. Simply Wall St has no position in any stocks mentioned.
Have feedback on this article? Concerned about the content? Get in touch with us directly. Alternatively, email editorial-team@simplywallst.com
About TSE:1994
Takahashi Curtain Wall
Engages in the PC curtain wall and aqua businesses in Japan.
Excellent balance sheet average dividend payer.
Market Insights

Community Narratives


