
Advertisement
- Japan
- /
- Construction
- /
- TSE:1965
Techno Ryowa Ltd. (TSE:1965) Might Not Be As Mispriced As It Looks After Plunging 27%
The Techno Ryowa Ltd. (TSE:1965) share price has fared very poorly over the last month, falling by a substantial 27%. Longer-term, the stock has been solid despite a difficult 30 days, gaining 17% in the last year.
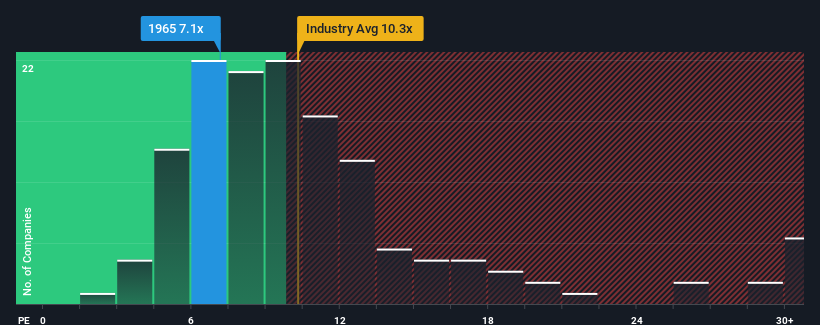
Even after such a large drop in price, Techno Ryowa may still be sending bullish signals at the moment with its price-to-earnings (or "P/E") ratio of 7.1x, since almost half of all companies in Japan have P/E ratios greater than 13x and even P/E's higher than 19x are not unusual. Although, it's not wise to just take the P/E at face value as there may be an explanation why it's limited.
With earnings growth that's exceedingly strong of late, Techno Ryowa has been doing very well. One possibility is that the P/E is low because investors think this strong earnings growth might actually underperform the broader market in the near future. If that doesn't eventuate, then existing shareholders have reason to be quite optimistic about the future direction of the share price.
See our latest analysis for Techno Ryowa
How Is Techno Ryowa's Growth Trending?
In order to justify its P/E ratio, Techno Ryowa would need to produce sluggish growth that's trailing the market.
If we review the last year of earnings growth, the company posted a terrific increase of 89%. The latest three year period has also seen an excellent 223% overall rise in EPS, aided by its short-term performance. Therefore, it's fair to say the earnings growth recently has been superb for the company.
This is in contrast to the rest of the market, which is expected to grow by 10% over the next year, materially lower than the company's recent medium-term annualised growth rates.
With this information, we find it odd that Techno Ryowa is trading at a P/E lower than the market. It looks like most investors are not convinced the company can maintain its recent growth rates.
The Bottom Line On Techno Ryowa's P/E
Techno Ryowa's P/E has taken a tumble along with its share price. While the price-to-earnings ratio shouldn't be the defining factor in whether you buy a stock or not, it's quite a capable barometer of earnings expectations.
Our examination of Techno Ryowa revealed its three-year earnings trends aren't contributing to its P/E anywhere near as much as we would have predicted, given they look better than current market expectations. There could be some major unobserved threats to earnings preventing the P/E ratio from matching this positive performance. It appears many are indeed anticipating earnings instability, because the persistence of these recent medium-term conditions would normally provide a boost to the share price.
Plus, you should also learn about these 2 warning signs we've spotted with Techno Ryowa (including 1 which doesn't sit too well with us).
Of course, you might find a fantastic investment by looking at a few good candidates. So take a peek at this free list of companies with a strong growth track record, trading on a low P/E.
Valuation is complex, but we're here to simplify it.
Discover if Techno Ryowa might be undervalued or overvalued with our detailed analysis, featuring fair value estimates, potential risks, dividends, insider trades, and its financial condition.
Access Free AnalysisHave feedback on this article? Concerned about the content? Get in touch with us directly. Alternatively, email editorial-team (at) simplywallst.com.
This article by Simply Wall St is general in nature. We provide commentary based on historical data and analyst forecasts only using an unbiased methodology and our articles are not intended to be financial advice. It does not constitute a recommendation to buy or sell any stock, and does not take account of your objectives, or your financial situation. We aim to bring you long-term focused analysis driven by fundamental data. Note that our analysis may not factor in the latest price-sensitive company announcements or qualitative material. Simply Wall St has no position in any stocks mentioned.
About TSE:1965
Techno Ryowa
Engages in the design, construction, and maintenance of environmental control systems primarily in Japan.
Flawless balance sheet with solid track record and pays a dividend.
Market Insights

Advertisement
Weekly Picks
WO

woodworthfund on MGP Ingredients ·
THE KINGDOM OF BROWN GOODS: WHY MGPI IS BEING CRUSHED BY INVENTORY & PRIMED FOR RESURRECTION
Fair Value:US$4039.0% undervalued
15 followersusers have followed this narrative
0 commentsusers have commented on this narrative
3 likesusers have liked this narrative
DO


Double_Bubbler on Vertical Aerospace ·
Why Vertical Aerospace (NYSE: EVTL) is Worth Possibly Over 13x its Current Price
Fair Value:US$6087.9% undervalued
19 followersusers have followed this narrative
1 commentusers have commented on this narrative
13 likesusers have liked this narrative
TI


TickerTickle on Oracle ·
The Quiet Giant That Became AI’s Power Grid
Fair Value:US$389.8143.2% undervalued
31 followersusers have followed this narrative
2 commentsusers have commented on this narrative
7 likesusers have liked this narrative
Recently Updated Narratives
LE

lexdrew1 on GE Vernova ·
GE Vernova revenue will grow by 13% with a future PE of 64.7x
Fair Value:US$824.5724.2% undervalued
5 followersusers have followed this narrative
0 commentsusers have commented on this narrative
0 likesusers have liked this narrative
GI

Gil263 on Butterfly Network ·
A buy recommendation
Fair Value:US$1.872.2% overvalued
2 followersusers have followed this narrative
1 commentusers have commented on this narrative
0 likesusers have liked this narrative
OP

OpenHorizons on Channel Vas Investments ·
Growing between 25-50% for the next 3-5 years
Fair Value:R12.1157.3% overvalued
1 followerusers have followed this narrative
0 commentsusers have commented on this narrative
0 likesusers have liked this narrative
Popular Narratives
TH


TheWallstreetKing on MicroVision ·
MicroVision will explode future revenue by 380.37% with a vision towards success
Fair Value:US$6098.4% undervalued
118 followersusers have followed this narrative
11 commentsusers have commented on this narrative
22 likesusers have liked this narrative
AN


AnalystConsensusTarget on NVIDIA ·
NVDA: Expanding AI Demand Will Drive Major Data Center Investments Through 2026
Fair Value:US$250.3926.1% undervalued
963 followersusers have followed this narrative
6 commentsusers have commented on this narrative
25 likesusers have liked this narrative
RO


RockeTeller on Santacruz Silver Mining ·
Crazy Undervalued 42 Baggers Silver Play (Active & Running Mine)
Fair Value:CA$8685.8% undervalued
76 followersusers have followed this narrative
8 commentsusers have commented on this narrative
21 likesusers have liked this narrative
