
Advertisement
- Japan
- /
- Construction
- /
- TSE:1942
These 4 Measures Indicate That KandenkoLtd (TSE:1942) Is Using Debt Reasonably Well

Howard Marks put it nicely when he said that, rather than worrying about share price volatility, 'The possibility of permanent loss is the risk I worry about... and every practical investor I know worries about.' So it seems the smart money knows that debt - which is usually involved in bankruptcies - is a very important factor, when you assess how risky a company is. Importantly, Kandenko Co.,Ltd. (TSE:1942) does carry debt. But should shareholders be worried about its use of debt?
When Is Debt Dangerous?
Generally speaking, debt only becomes a real problem when a company can't easily pay it off, either by raising capital or with its own cash flow. Part and parcel of capitalism is the process of 'creative destruction' where failed businesses are mercilessly liquidated by their bankers. While that is not too common, we often do see indebted companies permanently diluting shareholders because lenders force them to raise capital at a distressed price. Of course, plenty of companies use debt to fund growth, without any negative consequences. When we think about a company's use of debt, we first look at cash and debt together.
Check out our latest analysis for KandenkoLtd
What Is KandenkoLtd's Net Debt?
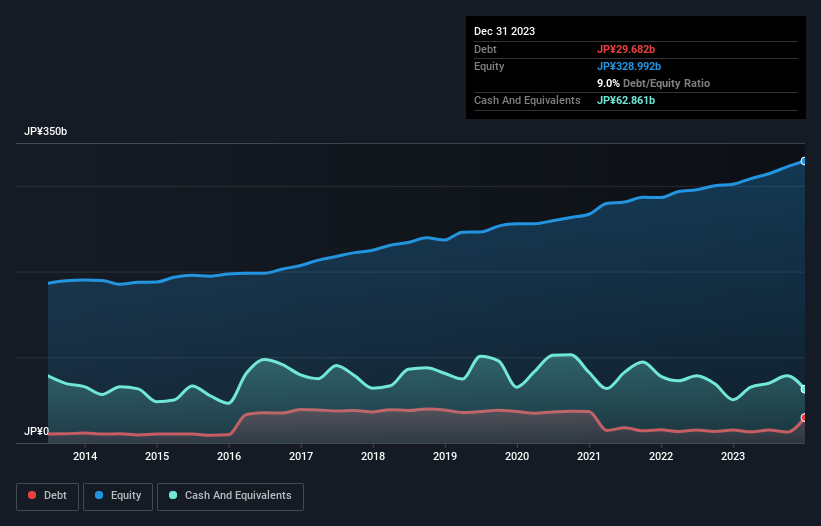
As you can see below, at the end of December 2023, KandenkoLtd had JP¥29.7b of debt, up from JP¥15.2b a year ago. Click the image for more detail. However, its balance sheet shows it holds JP¥62.9b in cash, so it actually has JP¥33.2b net cash.
How Healthy Is KandenkoLtd's Balance Sheet?
We can see from the most recent balance sheet that KandenkoLtd had liabilities of JP¥161.4b falling due within a year, and liabilities of JP¥30.2b due beyond that. Offsetting this, it had JP¥62.9b in cash and JP¥194.0b in receivables that were due within 12 months. So it actually has JP¥65.3b more liquid assets than total liabilities.
This excess liquidity suggests that KandenkoLtd is taking a careful approach to debt. Because it has plenty of assets, it is unlikely to have trouble with its lenders. Simply put, the fact that KandenkoLtd has more cash than debt is arguably a good indication that it can manage its debt safely.
And we also note warmly that KandenkoLtd grew its EBIT by 15% last year, making its debt load easier to handle. The balance sheet is clearly the area to focus on when you are analysing debt. But ultimately the future profitability of the business will decide if KandenkoLtd can strengthen its balance sheet over time. So if you're focused on the future you can check out this free report showing analyst profit forecasts.
Finally, a business needs free cash flow to pay off debt; accounting profits just don't cut it. While KandenkoLtd has net cash on its balance sheet, it's still worth taking a look at its ability to convert earnings before interest and tax (EBIT) to free cash flow, to help us understand how quickly it is building (or eroding) that cash balance. Looking at the most recent three years, KandenkoLtd recorded free cash flow of 33% of its EBIT, which is weaker than we'd expect. That weak cash conversion makes it more difficult to handle indebtedness.
Summing Up
While it is always sensible to investigate a company's debt, in this case KandenkoLtd has JP¥33.2b in net cash and a decent-looking balance sheet. And it impressed us with its EBIT growth of 15% over the last year. So we don't think KandenkoLtd's use of debt is risky. Over time, share prices tend to follow earnings per share, so if you're interested in KandenkoLtd, you may well want to click here to check an interactive graph of its earnings per share history.
At the end of the day, it's often better to focus on companies that are free from net debt. You can access our special list of such companies (all with a track record of profit growth). It's free.
Valuation is complex, but we're here to simplify it.
Discover if KandenkoLtd might be undervalued or overvalued with our detailed analysis, featuring fair value estimates, potential risks, dividends, insider trades, and its financial condition.
Access Free AnalysisHave feedback on this article? Concerned about the content? Get in touch with us directly. Alternatively, email editorial-team (at) simplywallst.com.
This article by Simply Wall St is general in nature. We provide commentary based on historical data and analyst forecasts only using an unbiased methodology and our articles are not intended to be financial advice. It does not constitute a recommendation to buy or sell any stock, and does not take account of your objectives, or your financial situation. We aim to bring you long-term focused analysis driven by fundamental data. Note that our analysis may not factor in the latest price-sensitive company announcements or qualitative material. Simply Wall St has no position in any stocks mentioned.
About TSE:1942
Flawless balance sheet with solid track record and pays a dividend.
Market Insights

Advertisement
Community Narratives

Apple: A Dying Star with an Overpriced Valuation
Fair Value US$177.34|19.2% overvalued
IN
Community Contributor
Avino a case for USD$20 per share within 5 years (assuming $3,500 gold, $100 silver and $4 copper).
Fair Value CA$26.79|86.0% undervalued
AG
Community Contributor
Riding the Defense Boom RENK Sees Revenue Climb at 15% CAGR by FY 2029
Fair Value €69.87|20.5% undervalued
CH
Community Contributor