

What financial metrics can indicate to us that a company is maturing or even in decline? When we see a declining return on capital employed (ROCE) in conjunction with a declining base of capital employed, that's often how a mature business shows signs of aging. Ultimately this means that the company is earning less per dollar invested and on top of that, it's shrinking its base of capital employed. In light of that, from a first glance at Tekken (TSE:1815), we've spotted some signs that it could be struggling, so let's investigate.
Return On Capital Employed (ROCE): What Is It?
For those who don't know, ROCE is a measure of a company's yearly pre-tax profit (its return), relative to the capital employed in the business. Analysts use this formula to calculate it for Tekken:
Return on Capital Employed = Earnings Before Interest and Tax (EBIT) ÷ (Total Assets - Current Liabilities)
0.027 = JP¥2.6b ÷ (JP¥269b - JP¥172b) (Based on the trailing twelve months to December 2024).
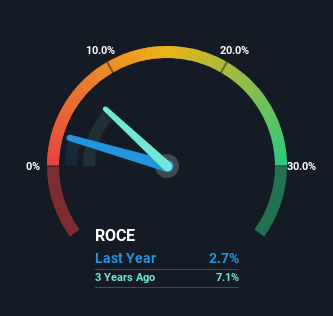
Thus, Tekken has an ROCE of 2.7%. Ultimately, that's a low return and it under-performs the Construction industry average of 8.9%.
View our latest analysis for Tekken
While the past is not representative of the future, it can be helpful to know how a company has performed historically, which is why we have this chart above. If you'd like to look at how Tekken has performed in the past in other metrics, you can view this free graph of Tekken's past earnings, revenue and cash flow .
So How Is Tekken's ROCE Trending?
In terms of Tekken's historical ROCE movements, the trend doesn't inspire confidence. To be more specific, the ROCE was 8.2% five years ago, but since then it has dropped noticeably. On top of that, it's worth noting that the amount of capital employed within the business has remained relatively steady. This combination can be indicative of a mature business that still has areas to deploy capital, but the returns received aren't as high due potentially to new competition or smaller margins. If these trends continue, we wouldn't expect Tekken to turn into a multi-bagger.
On a separate but related note, it's important to know that Tekken has a current liabilities to total assets ratio of 64%, which we'd consider pretty high. This can bring about some risks because the company is basically operating with a rather large reliance on its suppliers or other sorts of short-term creditors. Ideally we'd like to see this reduce as that would mean fewer obligations bearing risks.
The Bottom Line On Tekken's ROCE
In summary, it's unfortunate that Tekken is generating lower returns from the same amount of capital. In spite of that, the stock has delivered a 33% return to shareholders who held over the last five years. Regardless, we don't like the trends as they are and if they persist, we think you might find better investments elsewhere.
If you'd like to know more about Tekken, we've spotted 5 warning signs, and 2 of them are a bit concerning.
While Tekken isn't earning the highest return, check out this free list of companies that are earning high returns on equity with solid balance sheets.
Valuation is complex, but we're here to simplify it.
Discover if Tekken might be undervalued or overvalued with our detailed analysis, featuring fair value estimates, potential risks, dividends, insider trades, and its financial condition.
Access Free AnalysisHave feedback on this article? Concerned about the content? Get in touch with us directly. Alternatively, email editorial-team (at) simplywallst.com.
This article by Simply Wall St is general in nature. We provide commentary based on historical data and analyst forecasts only using an unbiased methodology and our articles are not intended to be financial advice. It does not constitute a recommendation to buy or sell any stock, and does not take account of your objectives, or your financial situation. We aim to bring you long-term focused analysis driven by fundamental data. Note that our analysis may not factor in the latest price-sensitive company announcements or qualitative material. Simply Wall St has no position in any stocks mentioned.
About TSE:1815
Tekken
Engages in the construction business in Japan and internationally.
Established dividend payer moderate.
Market Insights

Community Narratives


