
Advertisement
To find a multi-bagger stock, what are the underlying trends we should look for in a business? Ideally, a business will show two trends; firstly a growing return on capital employed (ROCE) and secondly, an increasing amount of capital employed. Basically this means that a company has profitable initiatives that it can continue to reinvest in, which is a trait of a compounding machine. However, after briefly looking over the numbers, we don't think Kajima (TSE:1812) has the makings of a multi-bagger going forward, but let's have a look at why that may be.
What Is Return On Capital Employed (ROCE)?
Just to clarify if you're unsure, ROCE is a metric for evaluating how much pre-tax income (in percentage terms) a company earns on the capital invested in its business. To calculate this metric for Kajima, this is the formula:
Return on Capital Employed = Earnings Before Interest and Tax (EBIT) ÷ (Total Assets - Current Liabilities)
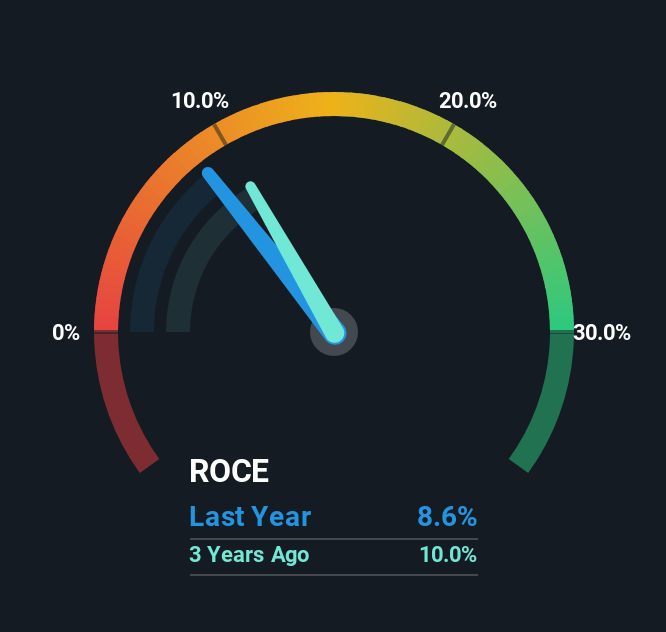
0.086 = JP¥151b ÷ (JP¥3.5t - JP¥1.7t) (Based on the trailing twelve months to March 2025).
Therefore, Kajima has an ROCE of 8.6%. On its own that's a low return on capital but it's in line with the industry's average returns of 9.2%.
See our latest analysis for Kajima
Above you can see how the current ROCE for Kajima compares to its prior returns on capital, but there's only so much you can tell from the past. If you'd like, you can check out the forecasts from the analysts covering Kajima for free.
So How Is Kajima's ROCE Trending?
In terms of Kajima's historical ROCE movements, the trend isn't fantastic. Over the last five years, returns on capital have decreased to 8.6% from 13% five years ago. On the other hand, the company has been employing more capital without a corresponding improvement in sales in the last year, which could suggest these investments are longer term plays. It's worth keeping an eye on the company's earnings from here on to see if these investments do end up contributing to the bottom line.
On a separate but related note, it's important to know that Kajima has a current liabilities to total assets ratio of 49%, which we'd consider pretty high. This can bring about some risks because the company is basically operating with a rather large reliance on its suppliers or other sorts of short-term creditors. While it's not necessarily a bad thing, it can be beneficial if this ratio is lower.

Our Take On Kajima's ROCE
In summary, Kajima is reinvesting funds back into the business for growth but unfortunately it looks like sales haven't increased much just yet. Yet to long term shareholders the stock has gifted them an incredible 270% return in the last five years, so the market appears to be rosy about its future. However, unless these underlying trends turn more positive, we wouldn't get our hopes up too high.
Kajima does have some risks though, and we've spotted 1 warning sign for Kajima that you might be interested in.
If you want to search for solid companies with great earnings, check out this free list of companies with good balance sheets and impressive returns on equity.
Valuation is complex, but we're here to simplify it.
Discover if Kajima might be undervalued or overvalued with our detailed analysis, featuring fair value estimates, potential risks, dividends, insider trades, and its financial condition.
Access Free AnalysisHave feedback on this article? Concerned about the content? Get in touch with us directly. Alternatively, email editorial-team (at) simplywallst.com.
This article by Simply Wall St is general in nature. We provide commentary based on historical data and analyst forecasts only using an unbiased methodology and our articles are not intended to be financial advice. It does not constitute a recommendation to buy or sell any stock, and does not take account of your objectives, or your financial situation. We aim to bring you long-term focused analysis driven by fundamental data. Note that our analysis may not factor in the latest price-sensitive company announcements or qualitative material. Simply Wall St has no position in any stocks mentioned.
About TSE:1812
Kajima
Engages in civil engineering, building construction, real estate development, architectural design, and other businesses worldwide.
Solid track record with adequate balance sheet and pays a dividend.
Similar Companies
Market Insights

Advertisement
Community Narratives
America Wants Homegrown Drones — Draganfly Is Ready to Deliver
Fair Value US$9.21|32.6% undervalued
JO
Community Contributor
Cheesecake Factory offers an enticing opportunity for long-term growth by leveraging new concepts
Fair Value US$73.83|25.6% undervalued
ZW
Community Contributor
Coca-Cola’s Intrinsic Value Set to Rise with Fed Rate Cut
Fair Value US$67.50|1.6% undervalued
AL
Community Contributor
Fully Permitted Gold Mine with 50 Baggers Potential 
Fair Value CA$41.00|98.2% undervalued
RO
Community Contributor