- Japan
- /
- Construction
- /
- TSE:1803
The three-year decline in earnings might be taking its toll on Shimizu (TSE:1803) shareholders as stock falls 3.8% over the past week


Low-cost index funds make it easy to achieve average market returns. But in any diversified portfolio of stocks, you'll see some that fall short of the average. Unfortunately for shareholders, while the Shimizu Corporation (TSE:1803) share price is up 13% in the last three years, that falls short of the market return. Zooming in, the stock is actually down 1.3% in the last year.
In light of the stock dropping 3.8% in the past week, we want to investigate the longer term story, and see if fundamentals have been the driver of the company's positive three-year return.
See our latest analysis for Shimizu
We don't think that Shimizu's modest trailing twelve month profit has the market's full attention at the moment. We think revenue is probably a better guide. Generally speaking, we'd consider a stock like this alongside loss-making companies, simply because the quantum of the profit is so low. For shareholders to have confidence a company will grow profits significantly, it must grow revenue.
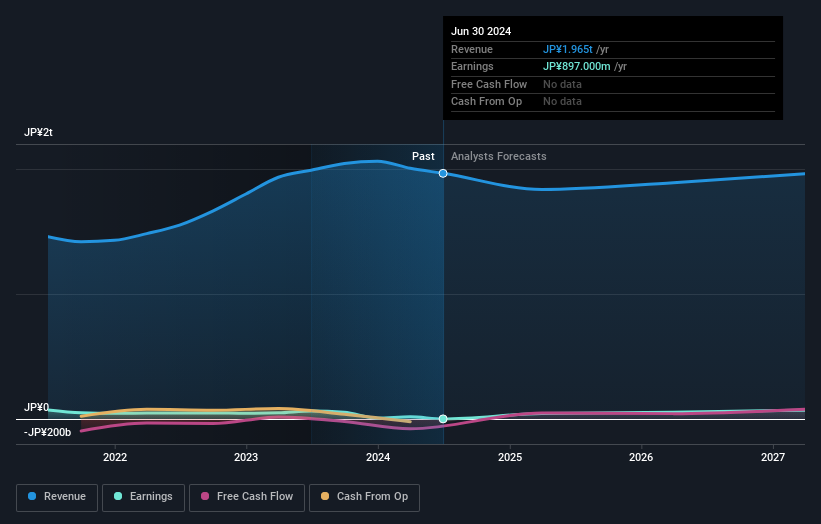
In the last 3 years Shimizu saw its revenue grow at 14% per year. That's pretty nice growth. The annual gain of 4% over three years is better than nothing, but hardly impresses. Arguably, that means, the market (previously) expected stronger growth from the company. However, if you can reasonably expect profits in the next few years, this stock might belong on your watchlist.
The graphic below depicts how earnings and revenue have changed over time (unveil the exact values by clicking on the image).
You can see how its balance sheet has strengthened (or weakened) over time in this free interactive graphic.
What About Dividends?
As well as measuring the share price return, investors should also consider the total shareholder return (TSR). The TSR is a return calculation that accounts for the value of cash dividends (assuming that any dividend received was reinvested) and the calculated value of any discounted capital raisings and spin-offs. Arguably, the TSR gives a more comprehensive picture of the return generated by a stock. As it happens, Shimizu's TSR for the last 3 years was 22%, which exceeds the share price return mentioned earlier. And there's no prize for guessing that the dividend payments largely explain the divergence!
A Different Perspective
Shimizu shareholders gained a total return of 0.5% during the year. But that was short of the market average. It's probably a good sign that the company has an even better long term track record, having provided shareholders with an annual TSR of 3% over five years. Maybe the share price is just taking a breather while the business executes on its growth strategy. While it is well worth considering the different impacts that market conditions can have on the share price, there are other factors that are even more important. For instance, we've identified 3 warning signs for Shimizu (1 is potentially serious) that you should be aware of.
Of course, you might find a fantastic investment by looking elsewhere. So take a peek at this free list of companies we expect will grow earnings.
Please note, the market returns quoted in this article reflect the market weighted average returns of stocks that currently trade on Japanese exchanges.
If you're looking to trade Shimizu, open an account with the lowest-cost platform trusted by professionals, Interactive Brokers.
With clients in over 200 countries and territories, and access to 160 markets, IBKR lets you trade stocks, options, futures, forex, bonds and funds from a single integrated account.
Enjoy no hidden fees, no account minimums, and FX conversion rates as low as 0.03%, far better than what most brokers offer.
Sponsored ContentNew: Manage All Your Stock Portfolios in One Place
We've created the ultimate portfolio companion for stock investors, and it's free.
• Connect an unlimited number of Portfolios and see your total in one currency
• Be alerted to new Warning Signs or Risks via email or mobile
• Track the Fair Value of your stocks
Have feedback on this article? Concerned about the content? Get in touch with us directly. Alternatively, email editorial-team (at) simplywallst.com.
This article by Simply Wall St is general in nature. We provide commentary based on historical data and analyst forecasts only using an unbiased methodology and our articles are not intended to be financial advice. It does not constitute a recommendation to buy or sell any stock, and does not take account of your objectives, or your financial situation. We aim to bring you long-term focused analysis driven by fundamental data. Note that our analysis may not factor in the latest price-sensitive company announcements or qualitative material. Simply Wall St has no position in any stocks mentioned.
About TSE:1803
Shimizu
Engages in the construction, development, engineering, and life cycle valuation businesses in Japan and internationally.
Acceptable track record with mediocre balance sheet.
Similar Companies
Market Insights


Community Narratives


