- Japan
- /
- Construction
- /
- TSE:1770
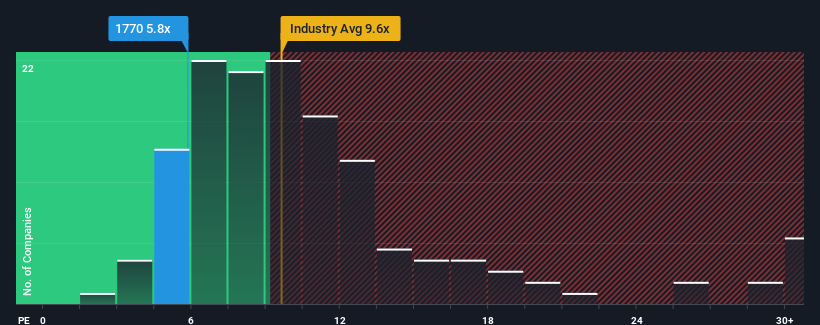
Investors Aren't Entirely Convinced By Fujita Engineering Co., Ltd.'s (TSE:1770) Earnings


Fujita Engineering Co., Ltd.'s (TSE:1770) price-to-earnings (or "P/E") ratio of 5.8x might make it look like a buy right now compared to the market in Japan, where around half of the companies have P/E ratios above 12x and even P/E's above 18x are quite common. Although, it's not wise to just take the P/E at face value as there may be an explanation why it's limited.
The earnings growth achieved at Fujita Engineering over the last year would be more than acceptable for most companies. One possibility is that the P/E is low because investors think this respectable earnings growth might actually underperform the broader market in the near future. If you like the company, you'd be hoping this isn't the case so that you could potentially pick up some stock while it's out of favour.
Check out our latest analysis for Fujita Engineering
Is There Any Growth For Fujita Engineering?
The only time you'd be truly comfortable seeing a P/E as low as Fujita Engineering's is when the company's growth is on track to lag the market.
If we review the last year of earnings growth, the company posted a terrific increase of 18%. Pleasingly, EPS has also lifted 50% in aggregate from three years ago, thanks to the last 12 months of growth. So we can start by confirming that the company has done a great job of growing earnings over that time.
Comparing that to the market, which is only predicted to deliver 10% growth in the next 12 months, the company's momentum is stronger based on recent medium-term annualised earnings results.
In light of this, it's peculiar that Fujita Engineering's P/E sits below the majority of other companies. It looks like most investors are not convinced the company can maintain its recent growth rates.
The Key Takeaway
We'd say the price-to-earnings ratio's power isn't primarily as a valuation instrument but rather to gauge current investor sentiment and future expectations.
Our examination of Fujita Engineering revealed its three-year earnings trends aren't contributing to its P/E anywhere near as much as we would have predicted, given they look better than current market expectations. There could be some major unobserved threats to earnings preventing the P/E ratio from matching this positive performance. At least price risks look to be very low if recent medium-term earnings trends continue, but investors seem to think future earnings could see a lot of volatility.
Having said that, be aware Fujita Engineering is showing 2 warning signs in our investment analysis, you should know about.
It's important to make sure you look for a great company, not just the first idea you come across. So take a peek at this free list of interesting companies with strong recent earnings growth (and a low P/E).
If you're looking to trade Fujita Engineering, open an account with the lowest-cost platform trusted by professionals, Interactive Brokers.
With clients in over 200 countries and territories, and access to 160 markets, IBKR lets you trade stocks, options, futures, forex, bonds and funds from a single integrated account.
Enjoy no hidden fees, no account minimums, and FX conversion rates as low as 0.03%, far better than what most brokers offer.
Sponsored ContentNew: AI Stock Screener & Alerts
Our new AI Stock Screener scans the market every day to uncover opportunities.
• Dividend Powerhouses (3%+ Yield)
• Undervalued Small Caps with Insider Buying
• High growth Tech and AI Companies
Or build your own from over 50 metrics.
Have feedback on this article? Concerned about the content? Get in touch with us directly. Alternatively, email editorial-team (at) simplywallst.com.
This article by Simply Wall St is general in nature. We provide commentary based on historical data and analyst forecasts only using an unbiased methodology and our articles are not intended to be financial advice. It does not constitute a recommendation to buy or sell any stock, and does not take account of your objectives, or your financial situation. We aim to bring you long-term focused analysis driven by fundamental data. Note that our analysis may not factor in the latest price-sensitive company announcements or qualitative material. Simply Wall St has no position in any stocks mentioned.
About TSE:1770
Fujita Engineering
Engages in the facilities construction business in Japan and internationally.
Excellent balance sheet with proven track record and pays a dividend.
Market Insights

Community Narratives

