Should We Be Excited About The Trends Of Returns At Takahashi Curtain Wall (TYO:1994)?


What are the early trends we should look for to identify a stock that could multiply in value over the long term? Firstly, we'd want to identify a growing return on capital employed (ROCE) and then alongside that, an ever-increasing base of capital employed. Ultimately, this demonstrates that it's a business that is reinvesting profits at increasing rates of return. However, after briefly looking over the numbers, we don't think Takahashi Curtain Wall (TYO:1994) has the makings of a multi-bagger going forward, but let's have a look at why that may be.
What is Return On Capital Employed (ROCE)?
Just to clarify if you're unsure, ROCE is a metric for evaluating how much pre-tax income (in percentage terms) a company earns on the capital invested in its business. To calculate this metric for Takahashi Curtain Wall, this is the formula:
Return on Capital Employed = Earnings Before Interest and Tax (EBIT) ÷ (Total Assets - Current Liabilities)
0.11 = JP¥1.1b ÷ (JP¥12b - JP¥2.2b) (Based on the trailing twelve months to September 2020).
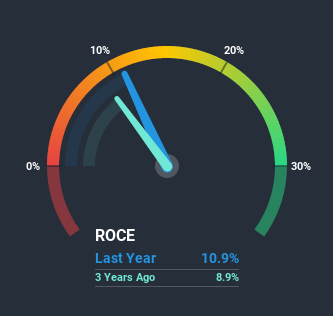
Thus, Takahashi Curtain Wall has an ROCE of 11%. On its own, that's a standard return, however it's much better than the 8.7% generated by the Building industry.
See our latest analysis for Takahashi Curtain Wall
While the past is not representative of the future, it can be helpful to know how a company has performed historically, which is why we have this chart above. If you want to delve into the historical earnings, revenue and cash flow of Takahashi Curtain Wall, check out these free graphs here.
What The Trend Of ROCE Can Tell Us
When we looked at the ROCE trend at Takahashi Curtain Wall, we didn't gain much confidence. Around five years ago the returns on capital were 22%, but since then they've fallen to 11%. And considering revenue has dropped while employing more capital, we'd be cautious. This could mean that the business is losing its competitive advantage or market share, because while more money is being put into ventures, it's actually producing a lower return - "less bang for their buck" per se.
On a side note, Takahashi Curtain Wall has done well to pay down its current liabilities to 18% of total assets. That could partly explain why the ROCE has dropped. What's more, this can reduce some aspects of risk to the business because now the company's suppliers or short-term creditors are funding less of its operations. Since the business is basically funding more of its operations with it's own money, you could argue this has made the business less efficient at generating ROCE.The Bottom Line
In summary, we're somewhat concerned by Takahashi Curtain Wall's diminishing returns on increasing amounts of capital. Despite the concerning underlying trends, the stock has actually gained 2.3% over the last five years, so it might be that the investors are expecting the trends to reverse. Either way, we aren't huge fans of the current trends and so with that we think you might find better investments elsewhere.
On a final note, we found 5 warning signs for Takahashi Curtain Wall (1 shouldn't be ignored) you should be aware of.
While Takahashi Curtain Wall isn't earning the highest return, check out this free list of companies that are earning high returns on equity with solid balance sheets.
When trading Takahashi Curtain Wall or any other investment, use the platform considered by many to be the Professional's Gateway to the Worlds Market, Interactive Brokers. You get the lowest-cost* trading on stocks, options, futures, forex, bonds and funds worldwide from a single integrated account. Promoted
Valuation is complex, but we're here to simplify it.
Discover if Takahashi Curtain Wall might be undervalued or overvalued with our detailed analysis, featuring fair value estimates, potential risks, dividends, insider trades, and its financial condition.
Access Free AnalysisThis article by Simply Wall St is general in nature. It does not constitute a recommendation to buy or sell any stock, and does not take account of your objectives, or your financial situation. We aim to bring you long-term focused analysis driven by fundamental data. Note that our analysis may not factor in the latest price-sensitive company announcements or qualitative material. Simply Wall St has no position in any stocks mentioned.
*Interactive Brokers Rated Lowest Cost Broker by StockBrokers.com Annual Online Review 2020
Have feedback on this article? Concerned about the content? Get in touch with us directly. Alternatively, email editorial-team (at) simplywallst.com.
About TSE:1994
Takahashi Curtain Wall
Engages in the PC curtain wall and aqua businesses in Japan.
Excellent balance sheet average dividend payer.
Market Insights

Community Narratives


