Mitsubishi UFJ Financial Group's (TSE:8306) 45% CAGR outpaced the company's earnings growth over the same three-year period


It might seem bad, but the worst that can happen when you buy a stock (without leverage) is that its share price goes to zero. But when you pick a company that is really flourishing, you can make more than 100%. For example, the Mitsubishi UFJ Financial Group, Inc. (TSE:8306) share price has soared 169% in the last three years. That sort of return is as solid as granite. On top of that, the share price is up 21% in about a quarter. But this could be related to the strong market, which is up 12% in the last three months.
Since it's been a strong week for Mitsubishi UFJ Financial Group shareholders, let's have a look at trend of the longer term fundamentals.
Check out our latest analysis for Mitsubishi UFJ Financial Group
While the efficient markets hypothesis continues to be taught by some, it has been proven that markets are over-reactive dynamic systems, and investors are not always rational. One flawed but reasonable way to assess how sentiment around a company has changed is to compare the earnings per share (EPS) with the share price.
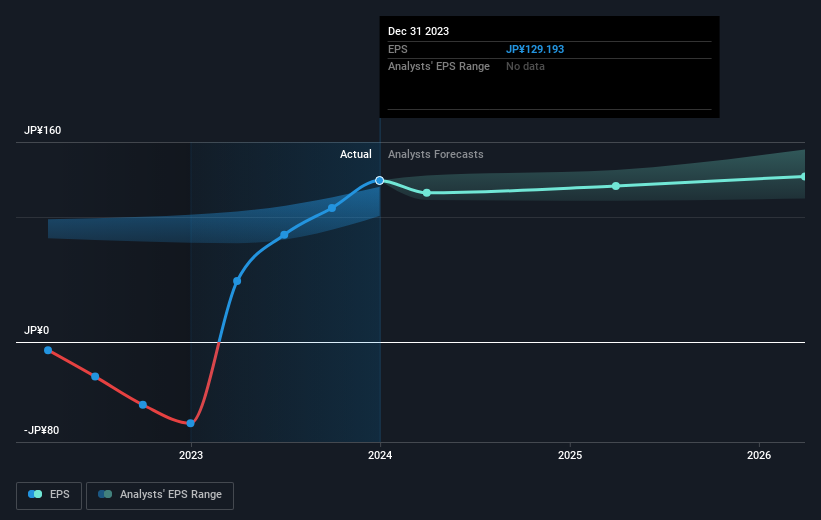
During three years of share price growth, Mitsubishi UFJ Financial Group moved from a loss to profitability. That kind of transition can be an inflection point that justifies a strong share price gain, just as we have seen here.
The image below shows how EPS has tracked over time (if you click on the image you can see greater detail).
It is of course excellent to see how Mitsubishi UFJ Financial Group has grown profits over the years, but the future is more important for shareholders. Take a more thorough look at Mitsubishi UFJ Financial Group's financial health with this free report on its balance sheet.
What About Dividends?
As well as measuring the share price return, investors should also consider the total shareholder return (TSR). Whereas the share price return only reflects the change in the share price, the TSR includes the value of dividends (assuming they were reinvested) and the benefit of any discounted capital raising or spin-off. So for companies that pay a generous dividend, the TSR is often a lot higher than the share price return. In the case of Mitsubishi UFJ Financial Group, it has a TSR of 202% for the last 3 years. That exceeds its share price return that we previously mentioned. And there's no prize for guessing that the dividend payments largely explain the divergence!
A Different Perspective
It's nice to see that Mitsubishi UFJ Financial Group shareholders have received a total shareholder return of 65% over the last year. That's including the dividend. That gain is better than the annual TSR over five years, which is 27%. Therefore it seems like sentiment around the company has been positive lately. In the best case scenario, this may hint at some real business momentum, implying that now could be a great time to delve deeper. Before deciding if you like the current share price, check how Mitsubishi UFJ Financial Group scores on these 3 valuation metrics.
Of course, you might find a fantastic investment by looking elsewhere. So take a peek at this free list of companies we expect will grow earnings.
Please note, the market returns quoted in this article reflect the market weighted average returns of stocks that currently trade on Japanese exchanges.
New: Manage All Your Stock Portfolios in One Place
We've created the ultimate portfolio companion for stock investors, and it's free.
• Connect an unlimited number of Portfolios and see your total in one currency
• Be alerted to new Warning Signs or Risks via email or mobile
• Track the Fair Value of your stocks
Have feedback on this article? Concerned about the content? Get in touch with us directly. Alternatively, email editorial-team (at) simplywallst.com.
This article by Simply Wall St is general in nature. We provide commentary based on historical data and analyst forecasts only using an unbiased methodology and our articles are not intended to be financial advice. It does not constitute a recommendation to buy or sell any stock, and does not take account of your objectives, or your financial situation. We aim to bring you long-term focused analysis driven by fundamental data. Note that our analysis may not factor in the latest price-sensitive company announcements or qualitative material. Simply Wall St has no position in any stocks mentioned.
About TSE:8306
Mitsubishi UFJ Financial Group
Operates as the bank holding company, that engages in a range of financial businesses in Japan, the United States, Europe, Asia/Oceania, and internationally.
Excellent balance sheet, good value and pays a dividend.

