Aisin (TSE:7259) continues to attract attention as investors look to the company’s recent performance and stock movements in Japan’s auto parts sector. With market sentiment shifting, many are re-examining Aisin’s value based on its fundamentals.
This year has seen Aisin’s share price surge, with momentum especially picking up over the past three months. This has helped drive an impressive 67.9% total shareholder return over the last year. Confidence seems to be building, signaling growing optimism about Aisin’s growth potential and the wider auto parts sector.
If you’re watching Aisin’s momentum, it is also a good moment to explore what’s happening across the auto manufacturers sector. Check out the See the full list for free.
With shares climbing and optimism high, the key question is whether Aisin’s current fundamentals justify its valuation. Alternatively, the market may have already factored in future gains, leaving little room for a bargain.
Advertisement
Price-to-Earnings of 14.1x: Is it justified?
Aisin currently trades at a price-to-earnings (P/E) ratio of 14.1x, making it appear more expensive than the auto parts industry average. With its last closing price at ¥2,549.5, investors may wonder if market enthusiasm has run too far ahead of underlying profits.
The price-to-earnings ratio is a fundamental metric that compares share price to earnings per share, capturing how much investors are willing to pay for future earnings. For auto component companies like Aisin, it reflects expectations about future growth, margins, and the broader demand cycle for auto parts.
While Aisin boasts strong recent earnings growth, its P/E ratio sits notably above the JP Auto Components industry average of 11.7x. However, when compared to its peer average of 14.7x and the fair price-to-earnings ratio estimate of 15.7x, its valuation appears more reasonable. This suggests potential upside if the market's optimism continues.
However, slowing annual revenue growth or a potential pullback from current highs could challenge the positive outlook on Aisin’s valuation and momentum.
Another View: SWS DCF Model Signals Undervaluation
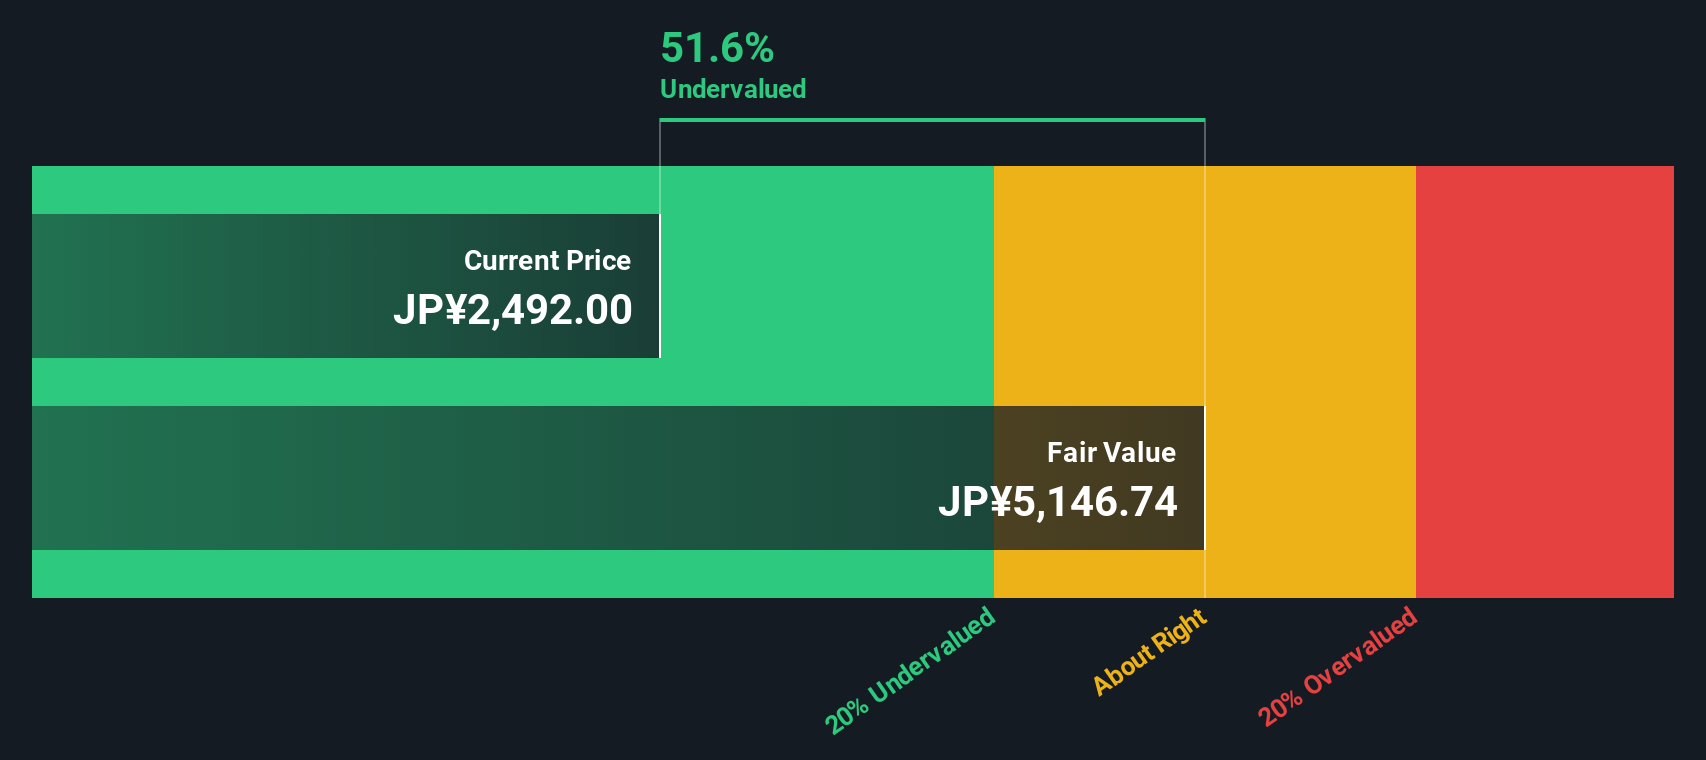
Looking through another lens, the SWS DCF model suggests Aisin is substantially undervalued, with shares trading around 50% below its estimated fair value of ¥5,163.67. This stands in sharp contrast to the higher-than-average price-to-earnings ratio discussed before. Could this gap point to a hidden opportunity, or is there more risk under the surface?
Simply Wall St performs a discounted cash flow (DCF) on every stock in the world every day (check out Aisin for example). We show the entire calculation in full. You can track the result in your watchlist or portfolio and be alerted when this changes, or use our stock screener to discover undervalued stocks based on their cash flows. If you save a screener we even alert you when new companies match - so you never miss a potential opportunity.
Build Your Own Aisin Narrative
If you would like to dig into the numbers yourself or have a different perspective, you can analyse the data and craft your own narrative in just a few minutes, with Do it your way.
If you want an edge in today's fast-moving markets, take action before opportunities slip away. Use these powerful tools to spot unique stocks and trends now:
Tap into high income potential with these 19 dividend stocks with yields > 3%, which offers yields above 3% for those seeking regular returns and proven performance.
Uncover tomorrow’s innovators by scanning these 24 AI penny stocks for game-changing companies that are pushing the boundaries of artificial intelligence and automation.
This article by Simply Wall St is general in nature. We provide commentary based on historical data
and analyst forecasts only using an unbiased methodology and our articles are not intended to be financial advice. It does not constitute a recommendation to buy or sell any stock, and does not take account of your objectives, or your
financial situation. We aim to bring you long-term focused analysis driven by fundamental data.
Note that our analysis may not factor in the latest price-sensitive company announcements or qualitative material.
Simply Wall St has no position in any stocks mentioned.
New: Manage All Your Stock Portfolios in One Place
We've created the ultimate portfolio companion for stock investors, and it's free.
• Connect an unlimited number of Portfolios and see your total in one currency • Be alerted to new Warning Signs or Risks via email or mobile • Track the Fair Value of your stocks