The 6.6% return this week takes Nissan Shatai's (TSE:7222) shareholders three-year gains to 41%

One simple way to benefit from the stock market is to buy an index fund. But many of us dare to dream of bigger returns, and build a portfolio ourselves. Just take a look at Nissan Shatai Co., Ltd. (TSE:7222), which is up 35%, over three years, soundly beating the market return of 25% (not including dividends). On the other hand, the returns haven't been quite so good recently, with shareholders up just 27%, including dividends.
On the back of a solid 7-day performance, let's check what role the company's fundamentals have played in driving long term shareholder returns.
Check out our latest analysis for Nissan Shatai
To quote Buffett, 'Ships will sail around the world but the Flat Earth Society will flourish. There will continue to be wide discrepancies between price and value in the marketplace...' One flawed but reasonable way to assess how sentiment around a company has changed is to compare the earnings per share (EPS) with the share price.
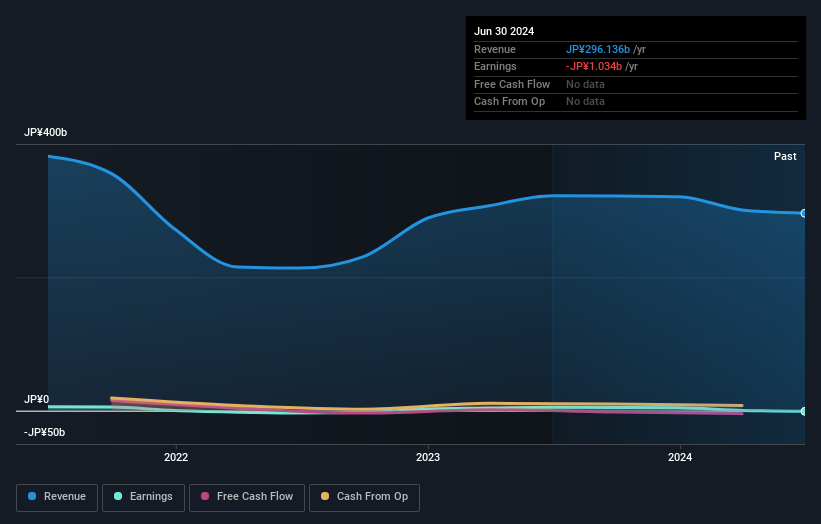
During the three years of share price growth, Nissan Shatai actually saw its earnings per share (EPS) drop 4.1% per year.
Companies are not always focussed on EPS growth in the short term, and looking at how the share price has reacted, we don't think EPS is the most important metric for Nissan Shatai at the moment. Therefore, it makes sense to look into other metrics.
Languishing at just 1.2%, we doubt the dividend is doing much to prop up the share price. Do you think that shareholders are buying for the 0.2% per annum revenue growth trend? We don't. So truth be told we can't see an easy explanation for the share price action, but perhaps you can...
You can see how earnings and revenue have changed over time in the image below (click on the chart to see the exact values).
Balance sheet strength is crucial. It might be well worthwhile taking a look at our free report on how its financial position has changed over time.
What About Dividends?
It is important to consider the total shareholder return, as well as the share price return, for any given stock. The TSR is a return calculation that accounts for the value of cash dividends (assuming that any dividend received was reinvested) and the calculated value of any discounted capital raisings and spin-offs. Arguably, the TSR gives a more comprehensive picture of the return generated by a stock. In the case of Nissan Shatai, it has a TSR of 41% for the last 3 years. That exceeds its share price return that we previously mentioned. And there's no prize for guessing that the dividend payments largely explain the divergence!
A Different Perspective
We're pleased to report that Nissan Shatai shareholders have received a total shareholder return of 27% over one year. And that does include the dividend. That gain is better than the annual TSR over five years, which is 6%. Therefore it seems like sentiment around the company has been positive lately. Someone with an optimistic perspective could view the recent improvement in TSR as indicating that the business itself is getting better with time. I find it very interesting to look at share price over the long term as a proxy for business performance. But to truly gain insight, we need to consider other information, too. Even so, be aware that Nissan Shatai is showing 1 warning sign in our investment analysis , you should know about...
Of course Nissan Shatai may not be the best stock to buy. So you may wish to see this free collection of growth stocks.
Please note, the market returns quoted in this article reflect the market weighted average returns of stocks that currently trade on Japanese exchanges.
Valuation is complex, but we're here to simplify it.
Discover if Nissan Shatai might be undervalued or overvalued with our detailed analysis, featuring fair value estimates, potential risks, dividends, insider trades, and its financial condition.
Access Free AnalysisHave feedback on this article? Concerned about the content? Get in touch with us directly. Alternatively, email editorial-team (at) simplywallst.com.
This article by Simply Wall St is general in nature. We provide commentary based on historical data and analyst forecasts only using an unbiased methodology and our articles are not intended to be financial advice. It does not constitute a recommendation to buy or sell any stock, and does not take account of your objectives, or your financial situation. We aim to bring you long-term focused analysis driven by fundamental data. Note that our analysis may not factor in the latest price-sensitive company announcements or qualitative material. Simply Wall St has no position in any stocks mentioned.
About TSE:7222
Nissan Shatai
Designs, develops, manufactures, and sells vehicles in Japan and internationally.
Flawless balance sheet unattractive dividend payer.

