Advertisement
Is Now the Right Time to Look at Toyota After Its Stock Jumps 6.5% This Week?

Simply Wall St
Reviewed by Bailey Pemberton
Trying to decide what to do with Toyota Motor stock? You are not alone. With the shares notching an impressive 22.4% gain over the past year and a massive 159.6% jump in the last five years, it's become a company that has everyone's attention, whether you are a long-term holder or someone just now eyeing an entry point. In the last week alone, Toyota's stock surged 6.5%, providing fresh fuel for anyone who wants to debate if this rally is just getting started or due for a pause.
Recent news out of the auto giant points to big bets on electric vehicles and persistent strength in traditional hybrid models. Toyota has also been ramping up its investment in battery technology and forging new partnerships in emerging markets, moves that many analysts see as strategic pivots designed to keep the company ahead of industry shifts. While not every headline creates instant waves in the stock price, the steady drumbeat of innovation is certainly influencing how investors perceive Toyota's future risk and return profile.
So how does all that excitement translate into valuation? By the numbers, Toyota gets a value score of 3 out of 6, meaning it looks undervalued in half of the checks we track. That leaves plenty of room for nuance, and it is where our deep dive begins. Next, let's break down the traditional valuation methods analysts use, and why looking at the usual ratios only tells part of the story. Wait until you see how a different perspective might put Toyota's real worth into even sharper focus.
Approach 1: Toyota Motor Discounted Cash Flow (DCF) Analysis
The Discounted Cash Flow (DCF) model estimates a company’s value by projecting its future cash flows and discounting them back to today’s terms. This approach essentially answers the question, “What is Toyota’s business worth if you had to pay for it all right now?”
For Toyota Motor, the model begins with the company’s most recent Free Cash Flow (FCF), which actually stands at negative ¥297.3 Billion. Looking ahead, analysts forecast FCF to bounce back and steadily grow, reaching about ¥2.48 Trillion by 2030. These projections suggest a significant ramp-up, with growth estimates from multiple analyst sources for the next five years and further extrapolation by Simply Wall St for later years. All cash flow estimates are expressed in Japanese yen (¥).
Running these forecasts through the DCF model results in a fair value estimate of ¥1,743 per share. However, with Toyota’s current market valuation, the DCF implies the stock is trading at a 78.0% premium to its projected intrinsic value. This means it appears substantially overvalued considering its future cash flow prospects.
Result: OVERVALUED
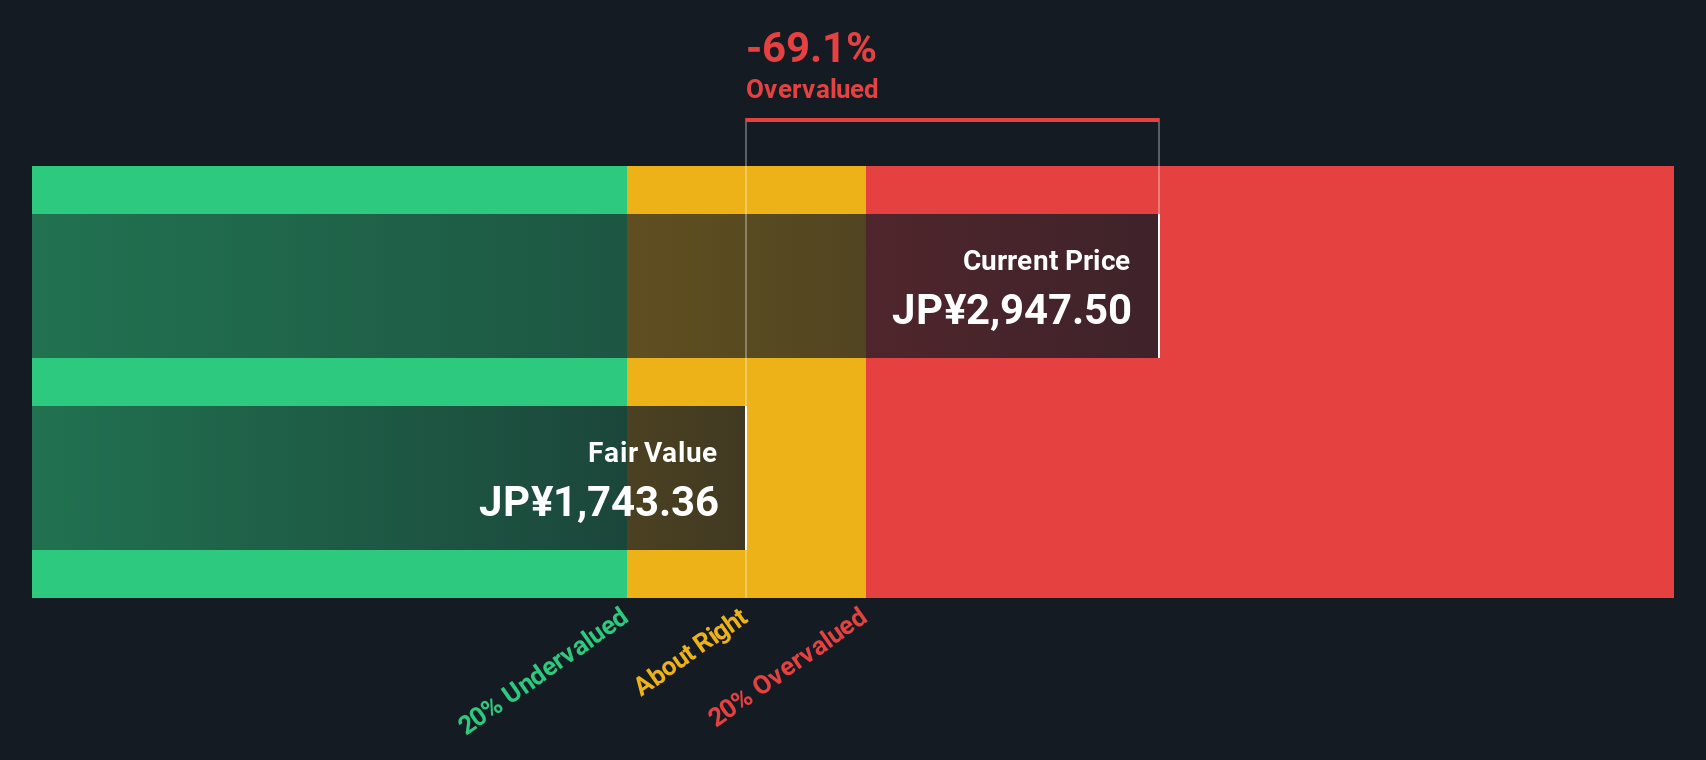
Our Discounted Cash Flow (DCF) analysis suggests Toyota Motor may be overvalued by 78.0%. Find undervalued stocks or create your own screener to find better value opportunities.
Approach 2: Toyota Motor Price vs Earnings (PE)
The price-to-earnings (PE) ratio is a widely used valuation metric for profitable companies like Toyota Motor because it shows how much investors are willing to pay for each yen of the company’s earnings. A low PE can signal value if earnings are stable, while a high PE may reflect optimism about future growth or lower risk.
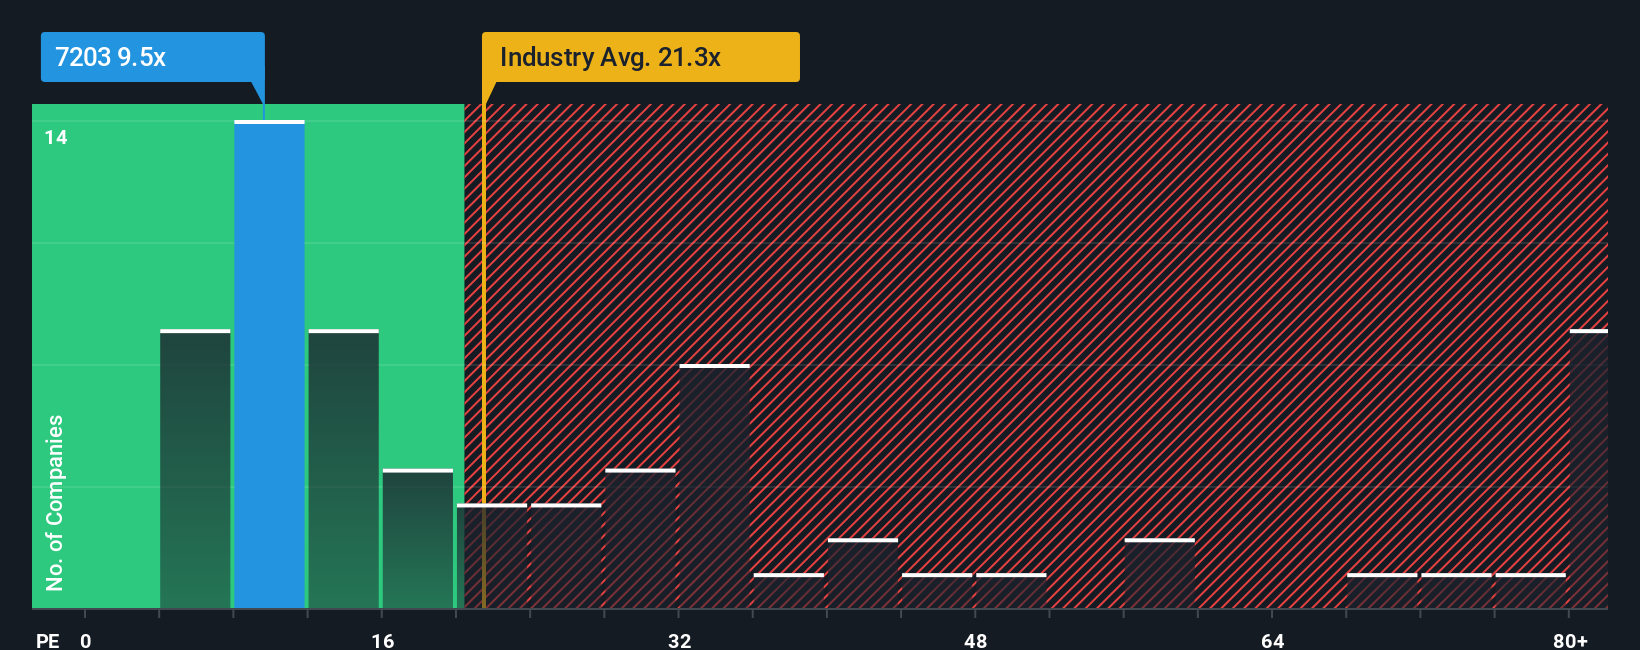
Growth expectations and risk play a big role in where a “normal” or “fair” PE ratio should sit. Higher expected growth and stronger financials can justify a higher PE, while greater uncertainties or weaker prospects can pull the multiple down. For Toyota, the current PE ratio stands at 9.47x.
Let’s put that in context. The average PE across Toyota’s Auto industry peers is 18.35x, and the peer group sits at 9.88x. This places Toyota slightly below its immediate competitors and well beneath the broader industry. However, Simply Wall St’s proprietary “Fair Ratio” adjusts for more than just peer performance. By taking into account Toyota’s earnings growth outlook, profit margins, scale, and risk profile, it arrives at a fair PE of 16.01x for Toyota specifically.
Comparing Toyota’s actual PE of 9.47x to its Fair Ratio of 16.01x suggests the stock is trading at a noteworthy discount to where it “should” be, considering the company’s unique mix of growth, risk, and profitability factors.
Result: UNDERVALUED
PE ratios tell one story, but what if the real opportunity lies elsewhere? Discover companies where insiders are betting big on explosive growth.
Upgrade Your Decision Making: Choose your Toyota Motor Narrative
Earlier we mentioned there is an even better way to understand valuation, so let's introduce you to Narratives. A Narrative is a simple, guided way to express your view of Toyota Motor by turning your perspective about the company’s story, such as future revenue, earnings, or profit margins, into a financial forecast that leads directly to your own fair value estimate. Narratives bridge the gap between the “why” and the “what” by linking Toyota’s business developments and strategy with the numbers investors care about most.
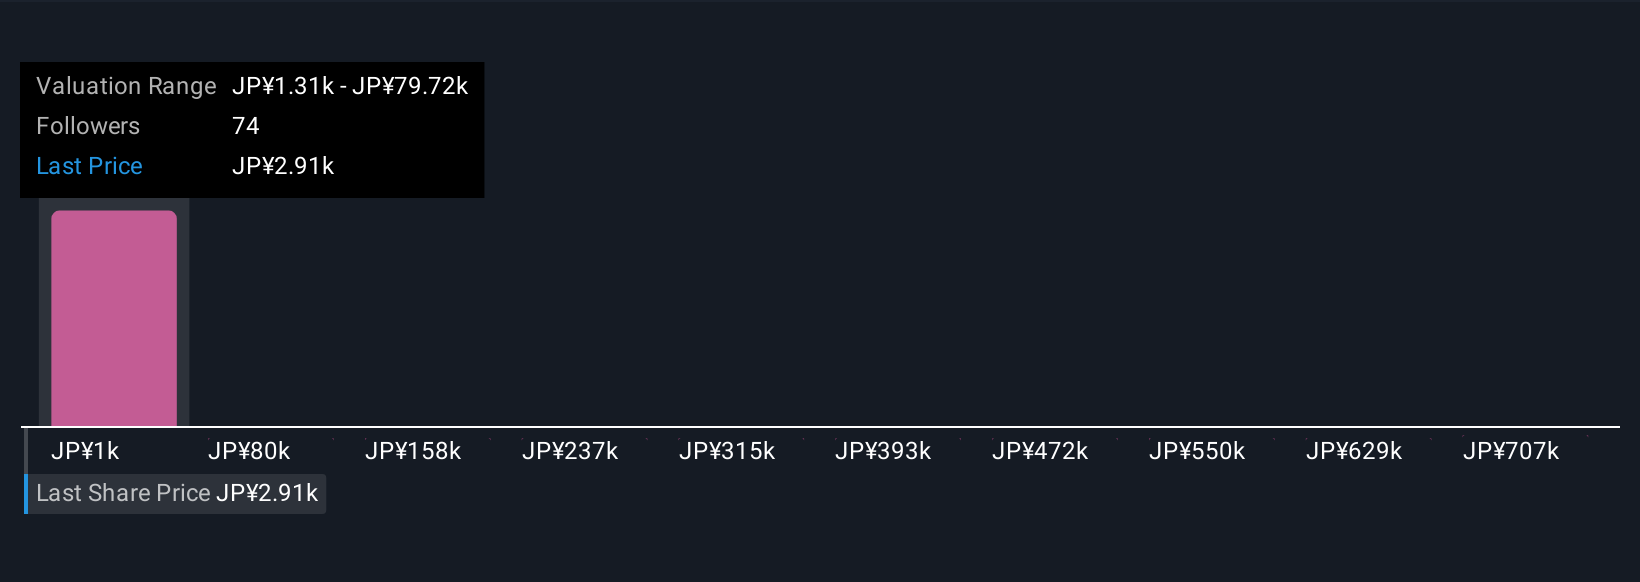
This tool, available for free to all users on Simply Wall St’s Community page, is designed to be accessible no matter your investing experience. Narratives empower you to clearly see how your outlook, whether positive, cautious, or skeptical, translates into a fair value and actionable insight. As news breaks or new earnings details emerge, Narratives update dynamically and always keep your thinking current. For example, one investor might believe Toyota's leadership in hybrid vehicles and production scale warrant a high fair value near ¥3,400 per share, while a more cautious investor might see competitive risks and set their fair value as low as ¥2,400. With Narratives, you can easily compare these perspectives to Toyota’s current price and make a decision that truly reflects your own convictions.
Do you think there's more to the story for Toyota Motor? Create your own Narrative to let the Community know!
This article by Simply Wall St is general in nature. We provide commentary based on historical data and analyst forecasts only using an unbiased methodology and our articles are not intended to be financial advice. It does not constitute a recommendation to buy or sell any stock, and does not take account of your objectives, or your financial situation. We aim to bring you long-term focused analysis driven by fundamental data. Note that our analysis may not factor in the latest price-sensitive company announcements or qualitative material. Simply Wall St has no position in any stocks mentioned.
Valuation is complex, but we're here to simplify it.
Discover if Toyota Motor might be undervalued or overvalued with our detailed analysis, featuring fair value estimates, potential risks, dividends, insider trades, and its financial condition.
Access Free AnalysisHave feedback on this article? Concerned about the content? Get in touch with us directly. Alternatively, email editorial-team@simplywallst.com
About TSE:7203
Toyota Motor
Designs, manufactures, assembles, and sells passenger vehicles, minivans and commercial vehicles, and related parts and accessories in Japan, North America, Europe, Asia, Central and South America, Oceania, Africa, and the Middle East.
Adequate balance sheet average dividend payer.
Similar Companies
Market Insights

Advertisement
Community Narratives
Finding The True Value Of A Logistics Powerhouse
Fair Value US$95.21|8.6% undervalued
NV
Community Contributor
Paradigm Biopharmaceuticals Will Lead Osteoarthritis Treatment with Zilosul's FDA Success
Fair Value AU$5.50|91.9% undervalued
AM
Community Contributor
Barrick Mining (ABX:CA): A Gold Hedge against a U.S. Shutdown
Fair Value CA$60.00|25.6% undervalued
GM
Community Contributor