
Advertisement
- Japan
- /
- Auto Components
- /
- TSE:6584
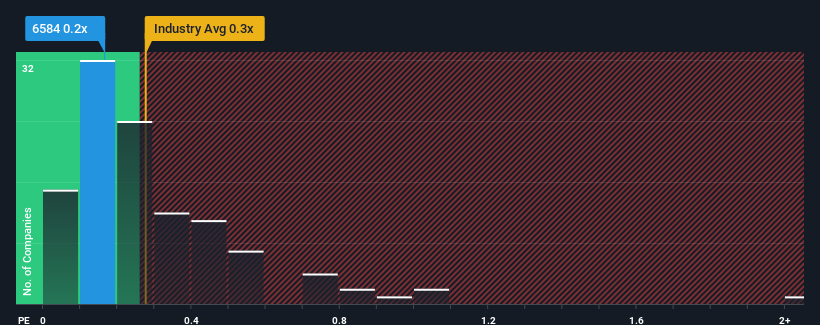
Sanoh Industrial Co., Ltd.'s (TSE:6584) Stock Retreats 29% But Revenues Haven't Escaped The Attention Of Investors

Sanoh Industrial Co., Ltd. (TSE:6584) shareholders that were waiting for something to happen have been dealt a blow with a 29% share price drop in the last month. Instead of being rewarded, shareholders who have already held through the last twelve months are now sitting on a 15% share price drop.
Although its price has dipped substantially, it's still not a stretch to say that Sanoh Industrial's price-to-sales (or "P/S") ratio of 0.2x right now seems quite "middle-of-the-road" compared to the Auto Components industry in Japan, where the median P/S ratio is around 0.3x. However, investors might be overlooking a clear opportunity or potential setback if there is no rational basis for the P/S.
View our latest analysis for Sanoh Industrial
What Does Sanoh Industrial's P/S Mean For Shareholders?
Sanoh Industrial certainly has been doing a good job lately as it's been growing revenue more than most other companies. Perhaps the market is expecting this level of performance to taper off, keeping the P/S from soaring. If the company manages to stay the course, then investors should be rewarded with a share price that matches its revenue figures.
Keen to find out how analysts think Sanoh Industrial's future stacks up against the industry? In that case, our free report is a great place to start.Is There Some Revenue Growth Forecasted For Sanoh Industrial?
There's an inherent assumption that a company should be matching the industry for P/S ratios like Sanoh Industrial's to be considered reasonable.
Retrospectively, the last year delivered a decent 14% gain to the company's revenues. The latest three year period has also seen an excellent 38% overall rise in revenue, aided somewhat by its short-term performance. Accordingly, shareholders would have definitely welcomed those medium-term rates of revenue growth.
Shifting to the future, estimates from the only analyst covering the company suggest revenue should grow by 5.7% per year over the next three years. That's shaping up to be similar to the 4.1% per annum growth forecast for the broader industry.
With this information, we can see why Sanoh Industrial is trading at a fairly similar P/S to the industry. It seems most investors are expecting to see average future growth and are only willing to pay a moderate amount for the stock.
The Final Word
Sanoh Industrial's plummeting stock price has brought its P/S back to a similar region as the rest of the industry. It's argued the price-to-sales ratio is an inferior measure of value within certain industries, but it can be a powerful business sentiment indicator.
Our look at Sanoh Industrial's revenue growth estimates show that its P/S is about what we expect, as both metrics follow closely with the industry averages. At this stage investors feel the potential for an improvement or deterioration in revenue isn't great enough to push P/S in a higher or lower direction. If all things remain constant, the possibility of a drastic share price movement remains fairly remote.
It's always necessary to consider the ever-present spectre of investment risk. We've identified 2 warning signs with Sanoh Industrial, and understanding them should be part of your investment process.
If companies with solid past earnings growth is up your alley, you may wish to see this free collection of other companies with strong earnings growth and low P/E ratios.
New: Manage All Your Stock Portfolios in One Place
We've created the ultimate portfolio companion for stock investors, and it's free.
• Connect an unlimited number of Portfolios and see your total in one currency
• Be alerted to new Warning Signs or Risks via email or mobile
• Track the Fair Value of your stocks
Have feedback on this article? Concerned about the content? Get in touch with us directly. Alternatively, email editorial-team (at) simplywallst.com.
This article by Simply Wall St is general in nature. We provide commentary based on historical data and analyst forecasts only using an unbiased methodology and our articles are not intended to be financial advice. It does not constitute a recommendation to buy or sell any stock, and does not take account of your objectives, or your financial situation. We aim to bring you long-term focused analysis driven by fundamental data. Note that our analysis may not factor in the latest price-sensitive company announcements or qualitative material. Simply Wall St has no position in any stocks mentioned.
Have feedback on this article? Concerned about the content? Get in touch with us directly. Alternatively, email editorial-team@simplywallst.com
About TSE:6584
Flawless balance sheet average dividend payer.
Similar Companies
Market Insights

Advertisement
Community Narratives
Scaling up in building materials with smart M&A and growing profitability
Fair Value US$2.77|30.0% undervalued
CM
Community Contributor
Hims: The Platform Powering Personalised Healthcare
Fair Value US$114.01|51.9% undervalued
BL
Community Contributor
Undervalued lottery company with strong fundamentals
Fair Value AU$15.00|34.5% undervalued
RO
Community Contributor
Proximus, transferring money from the impatient to the patient investor
Fair Value €16.62|55.1% undervalued
AX
Community Contributor