- Japan
- /
- Auto Components
- /
- TSE:6584
Sanoh Industrial Co., Ltd.'s (TSE:6584) P/S Is Still On The Mark Following 25% Share Price Bounce


Sanoh Industrial Co., Ltd. (TSE:6584) shares have had a really impressive month, gaining 25% after a shaky period beforehand. The last 30 days bring the annual gain to a very sharp 46%.
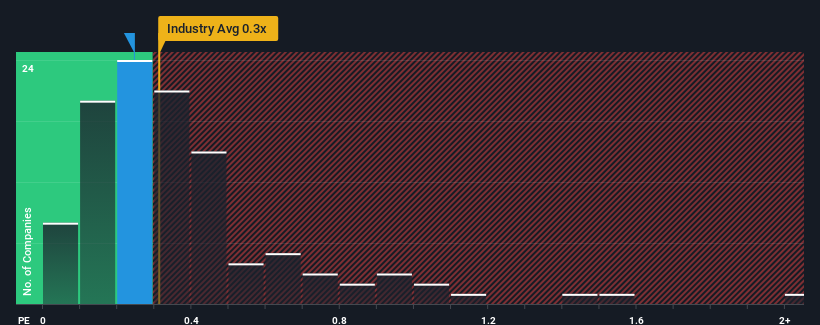
Even after such a large jump in price, there still wouldn't be many who think Sanoh Industrial's price-to-sales (or "P/S") ratio of 0.2x is worth a mention when the median P/S in Japan's Auto Components industry is similar at about 0.3x. Although, it's not wise to simply ignore the P/S without explanation as investors may be disregarding a distinct opportunity or a costly mistake.
View our latest analysis for Sanoh Industrial
What Does Sanoh Industrial's P/S Mean For Shareholders?
Sanoh Industrial certainly has been doing a good job lately as it's been growing revenue more than most other companies. It might be that many expect the strong revenue performance to wane, which has kept the P/S ratio from rising. If the company manages to stay the course, then investors should be rewarded with a share price that matches its revenue figures.
If you'd like to see what analysts are forecasting going forward, you should check out our free report on Sanoh Industrial.How Is Sanoh Industrial's Revenue Growth Trending?
Sanoh Industrial's P/S ratio would be typical for a company that's only expected to deliver moderate growth, and importantly, perform in line with the industry.
Retrospectively, the last year delivered an exceptional 15% gain to the company's top line. The strong recent performance means it was also able to grow revenue by 31% in total over the last three years. Therefore, it's fair to say the revenue growth recently has been superb for the company.
Looking ahead now, revenue is anticipated to climb by 4.8% during the coming year according to the only analyst following the company. With the industry predicted to deliver 4.2% growth , the company is positioned for a comparable revenue result.
In light of this, it's understandable that Sanoh Industrial's P/S sits in line with the majority of other companies. Apparently shareholders are comfortable to simply hold on while the company is keeping a low profile.
The Final Word
Sanoh Industrial appears to be back in favour with a solid price jump bringing its P/S back in line with other companies in the industry Generally, our preference is to limit the use of the price-to-sales ratio to establishing what the market thinks about the overall health of a company.
A Sanoh Industrial's P/S seems about right to us given the knowledge that analysts are forecasting a revenue outlook that is similar to the Auto Components industry. Right now shareholders are comfortable with the P/S as they are quite confident future revenue won't throw up any surprises. If all things remain constant, the possibility of a drastic share price movement remains fairly remote.
It's always necessary to consider the ever-present spectre of investment risk. We've identified 2 warning signs with Sanoh Industrial, and understanding them should be part of your investment process.
If you're unsure about the strength of Sanoh Industrial's business, why not explore our interactive list of stocks with solid business fundamentals for some other companies you may have missed.
If you're looking to trade Sanoh Industrial, open an account with the lowest-cost platform trusted by professionals, Interactive Brokers.
With clients in over 200 countries and territories, and access to 160 markets, IBKR lets you trade stocks, options, futures, forex, bonds and funds from a single integrated account.
Enjoy no hidden fees, no account minimums, and FX conversion rates as low as 0.03%, far better than what most brokers offer.
Sponsored ContentNew: Manage All Your Stock Portfolios in One Place
We've created the ultimate portfolio companion for stock investors, and it's free.
• Connect an unlimited number of Portfolios and see your total in one currency
• Be alerted to new Warning Signs or Risks via email or mobile
• Track the Fair Value of your stocks
Have feedback on this article? Concerned about the content? Get in touch with us directly. Alternatively, email editorial-team (at) simplywallst.com.
This article by Simply Wall St is general in nature. We provide commentary based on historical data and analyst forecasts only using an unbiased methodology and our articles are not intended to be financial advice. It does not constitute a recommendation to buy or sell any stock, and does not take account of your objectives, or your financial situation. We aim to bring you long-term focused analysis driven by fundamental data. Note that our analysis may not factor in the latest price-sensitive company announcements or qualitative material. Simply Wall St has no position in any stocks mentioned.
About TSE:6584
Flawless balance sheet average dividend payer.
Similar Companies
Market Insights

Community Narratives


