- Japan
- /
- Auto Components
- /
- TSE:5110
Sumitomo Rubber Industries, Ltd. (TSE:5110) Shares Could Be 33% Below Their Intrinsic Value Estimate

Key Insights
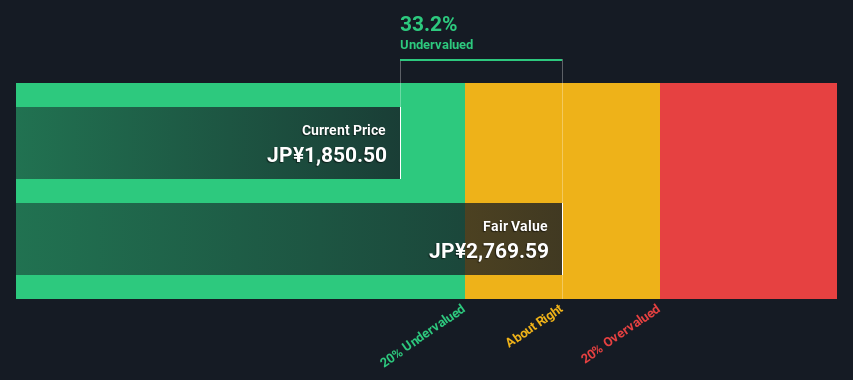
- The projected fair value for Sumitomo Rubber Industries is JP¥2,770 based on 2 Stage Free Cash Flow to Equity
- Current share price of JP¥1,851 suggests Sumitomo Rubber Industries is potentially 33% undervalued
- Analyst price target for 5110 is JP¥1,935 which is 30% below our fair value estimate
How far off is Sumitomo Rubber Industries, Ltd. (TSE:5110) from its intrinsic value? Using the most recent financial data, we'll take a look at whether the stock is fairly priced by estimating the company's future cash flows and discounting them to their present value. We will use the Discounted Cash Flow (DCF) model on this occasion. Don't get put off by the jargon, the math behind it is actually quite straightforward.
We would caution that there are many ways of valuing a company and, like the DCF, each technique has advantages and disadvantages in certain scenarios. Anyone interested in learning a bit more about intrinsic value should have a read of the Simply Wall St analysis model.
See our latest analysis for Sumitomo Rubber Industries
The Calculation
We use what is known as a 2-stage model, which simply means we have two different periods of growth rates for the company's cash flows. Generally the first stage is higher growth, and the second stage is a lower growth phase. To begin with, we have to get estimates of the next ten years of cash flows. Where possible we use analyst estimates, but when these aren't available we extrapolate the previous free cash flow (FCF) from the last estimate or reported value. We assume companies with shrinking free cash flow will slow their rate of shrinkage, and that companies with growing free cash flow will see their growth rate slow, over this period. We do this to reflect that growth tends to slow more in the early years than it does in later years.
Generally we assume that a dollar today is more valuable than a dollar in the future, and so the sum of these future cash flows is then discounted to today's value:
10-year free cash flow (FCF) estimate
| 2024 | 2025 | 2026 | 2027 | 2028 | 2029 | 2030 | 2031 | 2032 | 2033 | |
| Levered FCF (¥, Millions) | JP¥50.1b | JP¥41.3b | JP¥60.1b | JP¥56.1b | JP¥58.9b | JP¥60.8b | JP¥62.2b | JP¥63.2b | JP¥64.0b | JP¥64.5b |
| Growth Rate Estimate Source | Analyst x4 | Analyst x4 | Analyst x3 | Analyst x1 | Analyst x1 | Est @ 3.19% | Est @ 2.28% | Est @ 1.65% | Est @ 1.20% | Est @ 0.89% |
| Present Value (¥, Millions) Discounted @ 8.4% | JP¥46.3k | JP¥35.1k | JP¥47.2k | JP¥40.7k | JP¥39.4k | JP¥37.6k | JP¥35.5k | JP¥33.3k | JP¥31.1k | JP¥28.9k |
("Est" = FCF growth rate estimated by Simply Wall St)
Present Value of 10-year Cash Flow (PVCF) = JP¥375b
The second stage is also known as Terminal Value, this is the business's cash flow after the first stage. For a number of reasons a very conservative growth rate is used that cannot exceed that of a country's GDP growth. In this case we have used the 5-year average of the 10-year government bond yield (0.2%) to estimate future growth. In the same way as with the 10-year 'growth' period, we discount future cash flows to today's value, using a cost of equity of 8.4%.
Terminal Value (TV)= FCF2033 × (1 + g) ÷ (r – g) = JP¥65b× (1 + 0.2%) ÷ (8.4%– 0.2%) = JP¥789b
Present Value of Terminal Value (PVTV)= TV / (1 + r)10= JP¥789b÷ ( 1 + 8.4%)10= JP¥353b
The total value, or equity value, is then the sum of the present value of the future cash flows, which in this case is JP¥728b. The last step is to then divide the equity value by the number of shares outstanding. Relative to the current share price of JP¥1.9k, the company appears quite good value at a 33% discount to where the stock price trades currently. The assumptions in any calculation have a big impact on the valuation, so it is better to view this as a rough estimate, not precise down to the last cent.
Important Assumptions
We would point out that the most important inputs to a discounted cash flow are the discount rate and of course the actual cash flows. If you don't agree with these result, have a go at the calculation yourself and play with the assumptions. The DCF also does not consider the possible cyclicality of an industry, or a company's future capital requirements, so it does not give a full picture of a company's potential performance. Given that we are looking at Sumitomo Rubber Industries as potential shareholders, the cost of equity is used as the discount rate, rather than the cost of capital (or weighted average cost of capital, WACC) which accounts for debt. In this calculation we've used 8.4%, which is based on a levered beta of 1.456. Beta is a measure of a stock's volatility, compared to the market as a whole. We get our beta from the industry average beta of globally comparable companies, with an imposed limit between 0.8 and 2.0, which is a reasonable range for a stable business.
SWOT Analysis for Sumitomo Rubber Industries
- Earnings growth over the past year exceeded the industry.
- Debt is not viewed as a risk.
- Dividends are covered by earnings and cash flows.
- Dividend is low compared to the top 25% of dividend payers in the Auto Components market.
- Annual earnings are forecast to grow faster than the Japanese market.
- Trading below our estimate of fair value by more than 20%.
- Annual revenue is forecast to grow slower than the Japanese market.
Looking Ahead:
Although the valuation of a company is important, it shouldn't be the only metric you look at when researching a company. It's not possible to obtain a foolproof valuation with a DCF model. Rather it should be seen as a guide to "what assumptions need to be true for this stock to be under/overvalued?" If a company grows at a different rate, or if its cost of equity or risk free rate changes sharply, the output can look very different. What is the reason for the share price sitting below the intrinsic value? For Sumitomo Rubber Industries, there are three further aspects you should consider:
- Risks: Every company has them, and we've spotted 1 warning sign for Sumitomo Rubber Industries you should know about.
- Future Earnings: How does 5110's growth rate compare to its peers and the wider market? Dig deeper into the analyst consensus number for the upcoming years by interacting with our free analyst growth expectation chart.
- Other High Quality Alternatives: Do you like a good all-rounder? Explore our interactive list of high quality stocks to get an idea of what else is out there you may be missing!
PS. The Simply Wall St app conducts a discounted cash flow valuation for every stock on the TSE every day. If you want to find the calculation for other stocks just search here.
New: Manage All Your Stock Portfolios in One Place
We've created the ultimate portfolio companion for stock investors, and it's free.
• Connect an unlimited number of Portfolios and see your total in one currency
• Be alerted to new Warning Signs or Risks via email or mobile
• Track the Fair Value of your stocks
Have feedback on this article? Concerned about the content? Get in touch with us directly. Alternatively, email editorial-team (at) simplywallst.com.
This article by Simply Wall St is general in nature. We provide commentary based on historical data and analyst forecasts only using an unbiased methodology and our articles are not intended to be financial advice. It does not constitute a recommendation to buy or sell any stock, and does not take account of your objectives, or your financial situation. We aim to bring you long-term focused analysis driven by fundamental data. Note that our analysis may not factor in the latest price-sensitive company announcements or qualitative material. Simply Wall St has no position in any stocks mentioned.
About TSE:5110
Sumitomo Rubber Industries
Offers tires, sports, and industrial and other products in Japan and internationally.
Flawless balance sheet with moderate growth potential.
Market Insights

Community Narratives
