Advertisement
- Japan
- /
- Auto Components
- /
- TSE:5108
Does Bridgestone’s 33% 2025 Rally Signal Room for Further Growth?

Simply Wall St
Reviewed by Bailey Pemberton
If you have been watching Bridgestone stock and wondering whether now is the right time to make a move, you are not alone. There is plenty to talk about with this company, and the numbers make for a lively debate. Over the past year, Bridgestone’s stock price has jumped 28.7%, and if we zoom out to five years, the growth is even more impressive at 147.5%. Despite periods of global uncertainty, the stock’s steady climb suggests investors are seeing something more in the company, perhaps new growth potential or improved risk perception as market dynamics have shifted in the tire and rubber industry.
On a shorter timeline, the momentum looks solid: up 3.0% in just the last week and 1.6% over the past month. Year-to-date, we are talking about a 32.0% rise, which is not something you see every day for a longstanding industrial company. It is the sort of performance that makes both new and seasoned investors perk up, especially as Bridgestone navigates ongoing shifts in global supply chains and inflationary pressures impacting material costs across its sector.
But as strong as those numbers appear, no analysis is complete without talking about value. According to classic valuation measures, Bridgestone clocks in with a valuation score of 2 out of 6, meaning it ticks the box as undervalued in two categories but not across the board. Up next, we will break down what those valuation checks actually mean, and why the typical numbers only tell part of the story. By the end, you will have a clearer, more nuanced perspective on how to truly judge Bridgestone’s worth.
Bridgestone scores just 2/6 on our valuation checks. See what other red flags we found in the full valuation breakdown.
Approach 1: Bridgestone Discounted Cash Flow (DCF) Analysis
The Discounted Cash Flow (DCF) model is a valuation tool that estimates a company’s intrinsic value by projecting its future cash flows and then discounting them back to today’s value. This method helps investors understand what Bridgestone is fundamentally worth, based on how much cash it can generate going forward.
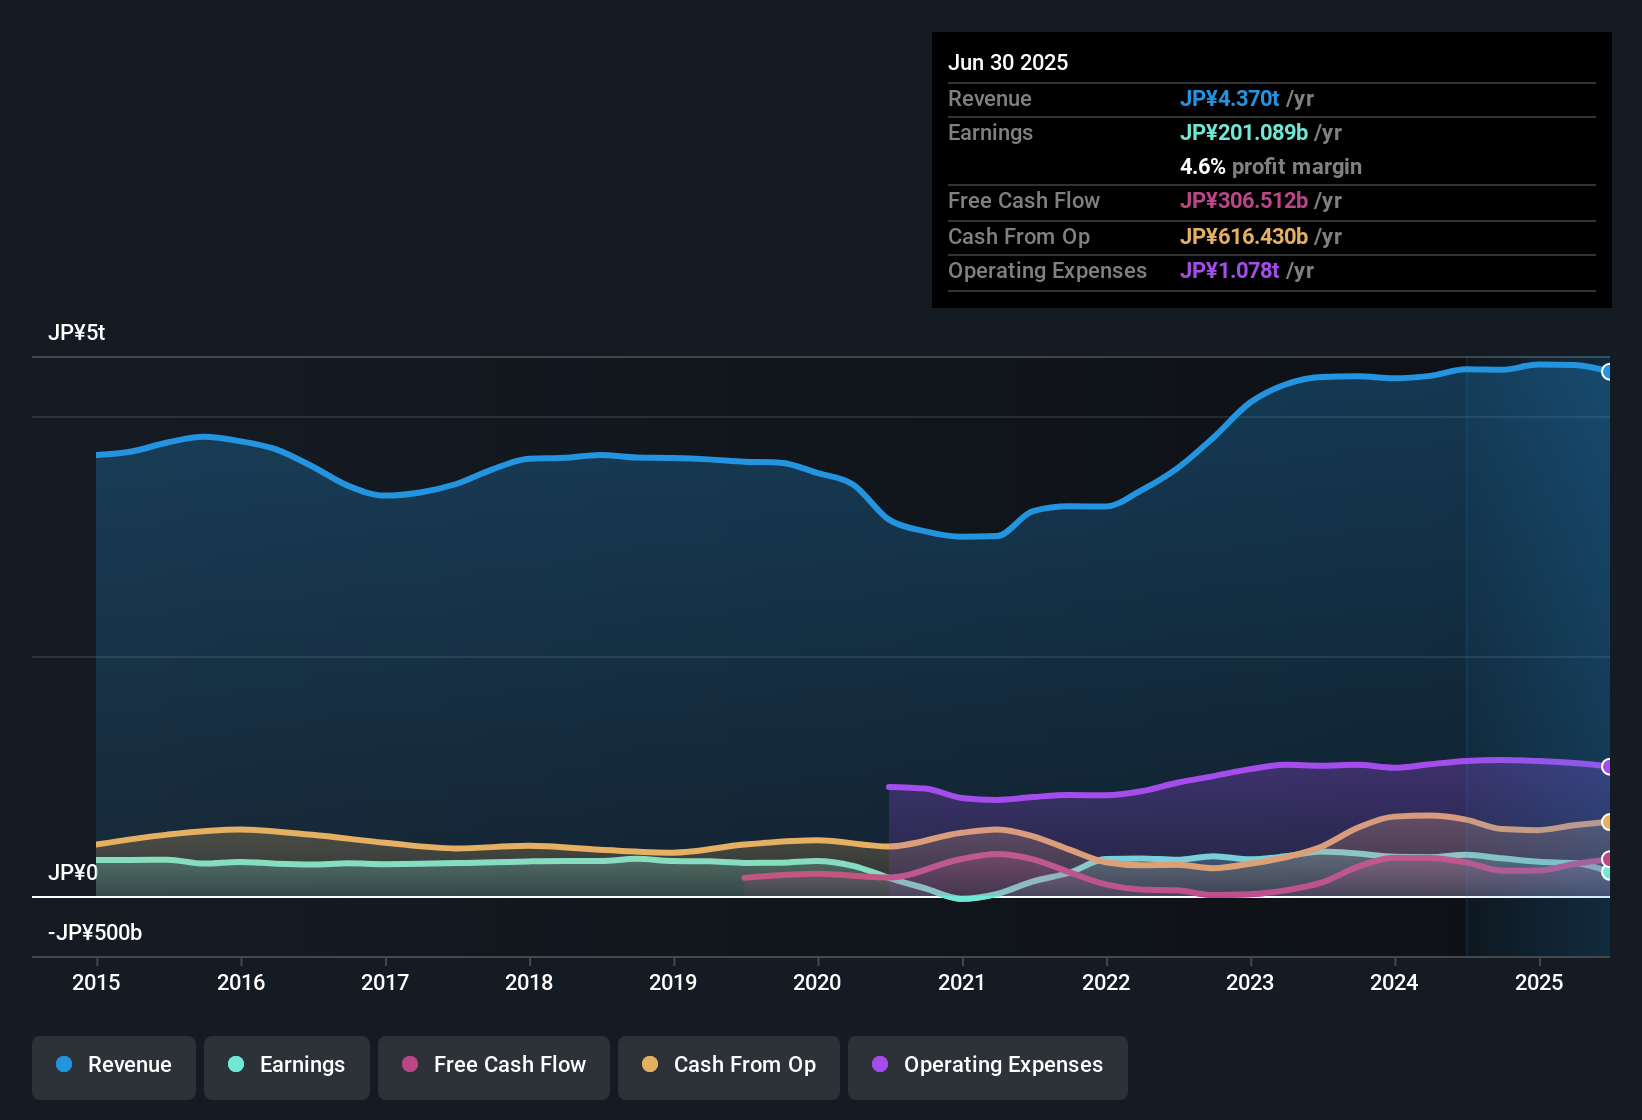
For Bridgestone, the reported Free Cash Flow (FCF) over the last twelve months stands at ¥294.2 billion. Analysts estimate that FCF will gradually increase to ¥469.5 billion by calendar year 2029. Beyond the next five years, future cash flows are projected by extending recent trends and analyst expectations, providing a rounded, decade-long outlook. The projections show a consistent pattern of rising cash flows, reflecting both organic growth and potentially improving efficiency as the company adapts to changes in its industry.
According to this DCF model, Bridgestone’s estimated intrinsic value is ¥12,994 per share. Given that the current market price is roughly 45.6% below this fair value, the DCF model indicates the stock is significantly undervalued at present.
Result: UNDERVALUED
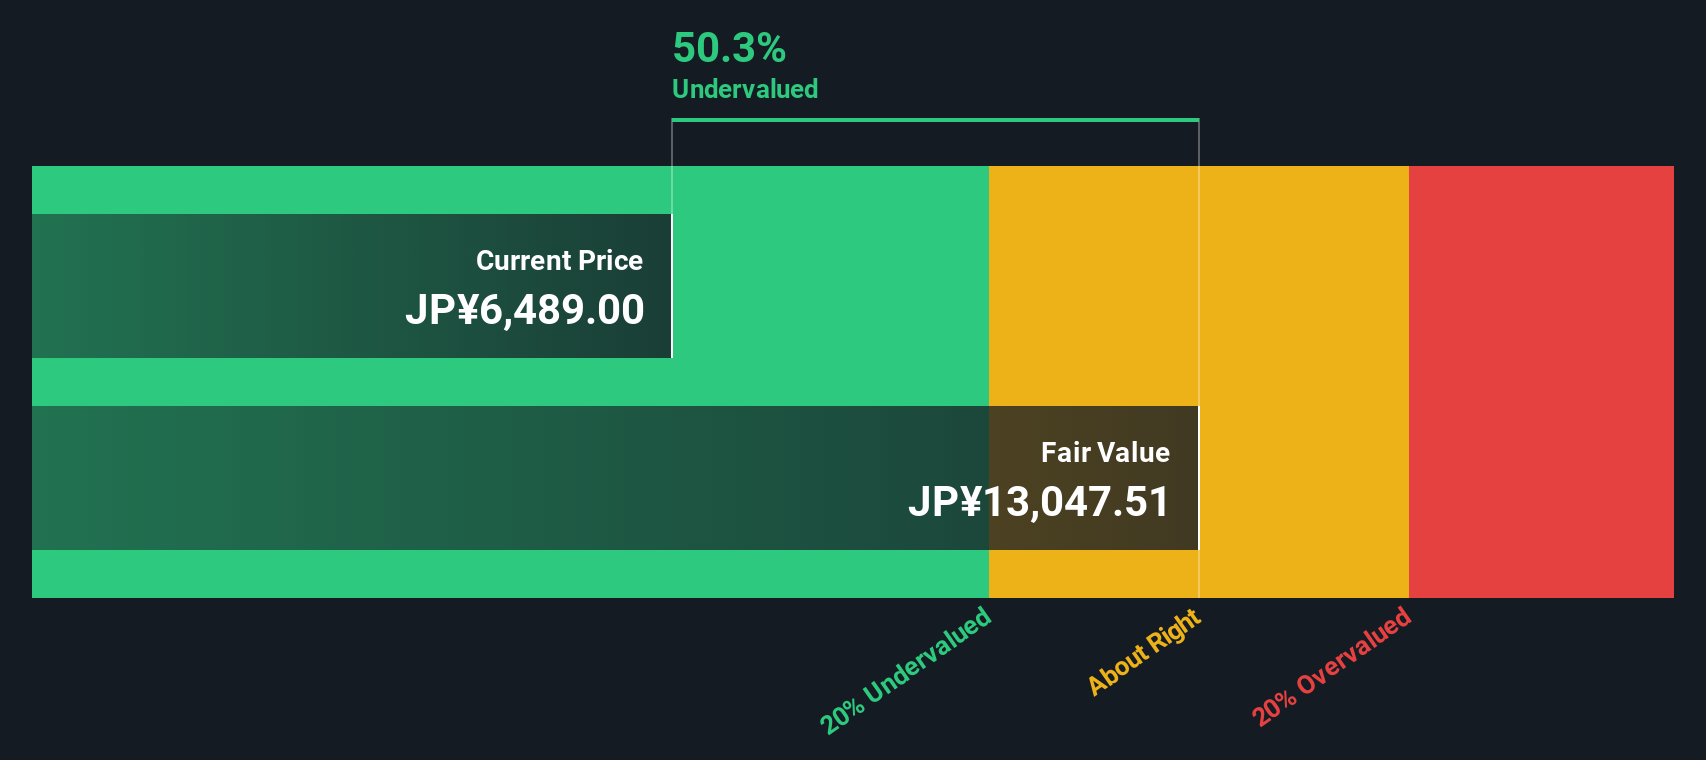
Our Discounted Cash Flow (DCF) analysis suggests Bridgestone is undervalued by 45.6%. Track this in your watchlist or portfolio, or discover more undervalued stocks.
Approach 2: Bridgestone Price vs Earnings
For profitable companies like Bridgestone, the Price-to-Earnings (PE) ratio is a reliable valuation tool. It shows how much investors are willing to pay for each yen of current earnings. In general, rapidly growing or lower-risk companies command higher PE ratios because investors anticipate bigger future profits, while mature or riskier firms tend to trade at lower multiples.
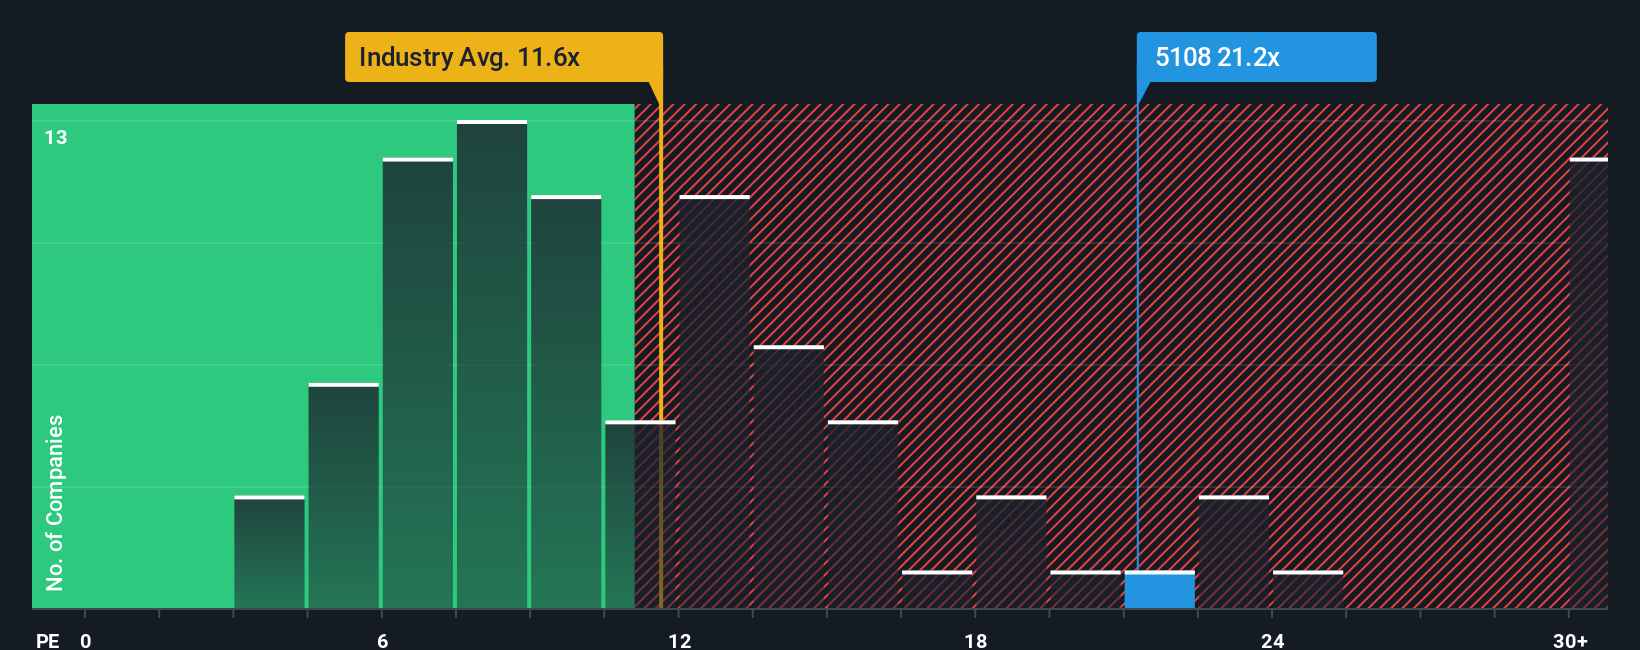
Currently, Bridgestone trades at a PE ratio of 23.2x. Compared to the Auto Components industry average of 11.1x and a peer group average of 13.9x, Bridgestone’s multiple is considerably higher. This gap could reflect the company’s strong fundamentals, expectations for improved earnings, or a premium for its scale and market presence.
However, simply comparing against industry or peer averages only tells part of the story. That is where Simply Wall St’s Fair Ratio comes in. The Fair Ratio for Bridgestone, at 19.7x, adjusts for the company’s growth rate, profit margins, risk profile, industry dynamics, and market cap, providing a more personalized benchmark. It moves beyond one-size-fits-all comparisons and gives a fuller picture.
With Bridgestone’s actual PE just a bit above its Fair Ratio, the stock appears slightly expensive on this metric, but the difference is not dramatic. This suggests investors are paying about the right price when all key factors are considered.
Result: ABOUT RIGHT
PE ratios tell one story, but what if the real opportunity lies elsewhere? Discover companies where insiders are betting big on explosive growth.
Upgrade Your Decision Making: Choose your Bridgestone Narrative
Earlier we mentioned that there is an even better way to understand valuation. Let us introduce you to Narratives. A Narrative is a way for you to express your own story about a company by combining your view of its business future with your personal estimates for things like revenue growth, profit margins, or fair value.
Instead of just relying on traditional ratios or analyst targets, Narratives let you link a company’s big-picture story and catalysts to a customized forecast. You can then translate that into your own fair value for the stock. It is a feature built right into Simply Wall St’s Community page, used by millions of investors to quickly see how the numbers change as their outlook shifts.
Narratives make it much easier for you to decide when to buy, sell, or hold by comparing your calculated Fair Value with today’s market price. Since they update live with the latest news, earnings, or announcements, your view remains relevant as the company evolves.
For example, some Bridgestone investors currently set their fair value as high as ¥7,600 based on optimism around premium tire growth and cost cuts. Others take a more cautious stance with lower targets like ¥6,100 due to concerns over regional profitability and industry headwinds.
With Narratives, you are empowered to build your own outlook and respond quickly as new information emerges.
Do you think there's more to the story for Bridgestone? Create your own Narrative to let the Community know!
This article by Simply Wall St is general in nature. We provide commentary based on historical data and analyst forecasts only using an unbiased methodology and our articles are not intended to be financial advice. It does not constitute a recommendation to buy or sell any stock, and does not take account of your objectives, or your financial situation. We aim to bring you long-term focused analysis driven by fundamental data. Note that our analysis may not factor in the latest price-sensitive company announcements or qualitative material. Simply Wall St has no position in any stocks mentioned.
Valuation is complex, but we're here to simplify it.
Discover if Bridgestone might be undervalued or overvalued with our detailed analysis, featuring fair value estimates, potential risks, dividends, insider trades, and its financial condition.
Access Free AnalysisHave feedback on this article? Concerned about the content? Get in touch with us directly. Alternatively, email editorial-team@simplywallst.com
About TSE:5108
Flawless balance sheet average dividend payer.
Similar Companies
Market Insights

Advertisement
Community Narratives
A formidable player in AI and enterprise computing.
Fair Value US$210.00|3.9% overvalued
CO
Community Contributor
IREN's Bold Moves in Sustainable Bitcoin Mining & AI Data Centers
Fair Value US$89.00|21.8% undervalued
BL
Community Contributor
Cooling the Champions: The Aussie Tech Behind F1's Victories
Fair Value AU$12.40|39.4% undervalued
TR
Community Contributor