Advertisement
Can Generali’s 2025 Valuation Hold After Five-Year 262% Rally?

Simply Wall St
Reviewed by Simply Wall St
If you have been following Assicurazioni Generali’s stock lately, you probably have questions. After all, we have seen the share price climb an incredible 262.7% over the last five years. Even with some recent cooling in the last month at -3.3%, the stock is still up an impressive 36.8% in the past year. There has been a steady drumbeat of demand, perhaps fueled by shifting investor perception and broader industry moves, with the company’s year-to-date return holding strong at 19.7%.
With movements like these, it is tempting to focus solely on momentum. Yet, even the most energetic rallies eventually slow down, and we need to ask ourselves: is Assicurazioni Generali still a bargain, or are we late to the party? This is especially relevant considering Assicurazioni Generali ticks the box for being undervalued in 2 out of 6 key checks, landing it a valuation score of 2. If you are wondering whether now is the right time to buy, sell, or hold, looking beyond just the headline numbers becomes essential.
That is where a closer look at underlying valuation methods comes in, from traditional price ratios to more nuanced measures. In the sections ahead, we will break down how Assicurazioni Generali stacks up using different valuation approaches and reveal an even sharper perspective on what those numbers really mean by the end of this article.
Assicurazioni Generali scores just 2/6 on our valuation checks. See what other red flags we found in the full valuation breakdown.Approach 1: Assicurazioni Generali Excess Returns Analysis
The Excess Returns model evaluates a company by measuring how much profit it earns above the basic cost of its equity capital. This approach shines a spotlight on how effectively Assicurazioni Generali converts its investments into additional value for shareholders, over and above what is typically expected in its industry.
For Assicurazioni Generali, the latest data presents a Book Value of €19.57 per share, and a projected Stable EPS of €3.23 per share, based on weighted future Return on Equity estimates from eight analysts. The company’s cost of equity stands at €2.29 per share, and its estimated excess return, which represents profits above the cost of capital, comes in at €0.94 per share. On average, Assicurazioni Generali is expected to deliver a 14.18% return on equity moving forward, with a stable Book Value estimate at €22.80 per share based on consensus from seven analysts.
Using these figures, the Excess Returns model places Assicurazioni Generali’s intrinsic value at €35.91 per share. With the model indicating the stock is trading at an 8.0% discount to this value, the analysis points to Assicurazioni Generali being about fairly valued in the current market.
Result: ABOUT RIGHT
Head to the Valuation section of our Company Report for more details on how we arrive at this Fair Value for Assicurazioni Generali.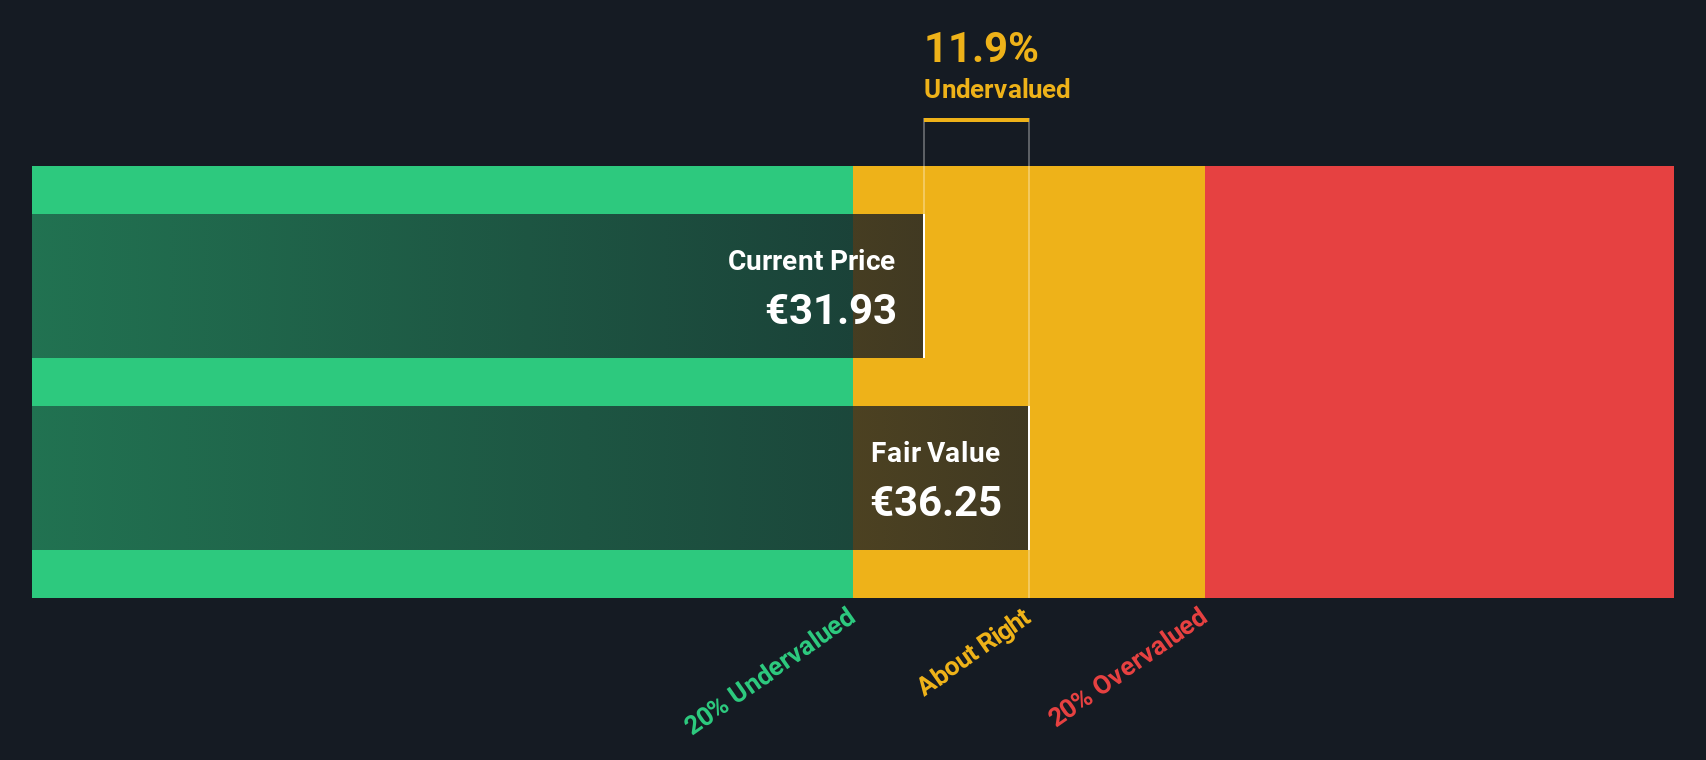
Approach 2: Assicurazioni Generali Price vs Earnings
The price-to-earnings (PE) ratio is a popular metric for valuing profitable companies like Assicurazioni Generali because it directly relates share price to underlying earnings, offering a clear snapshot of how the market values those profits. This multiple is most meaningful when earnings are stable and positive, as is the case here.
When assessing whether a company’s PE is “fair,” it is important to consider not just raw earnings, but also expectations for future growth and the risks unique to the business. Typically, higher growth or lower risk would justify a higher PE, while slow growth or higher risks would suppress the multiple.
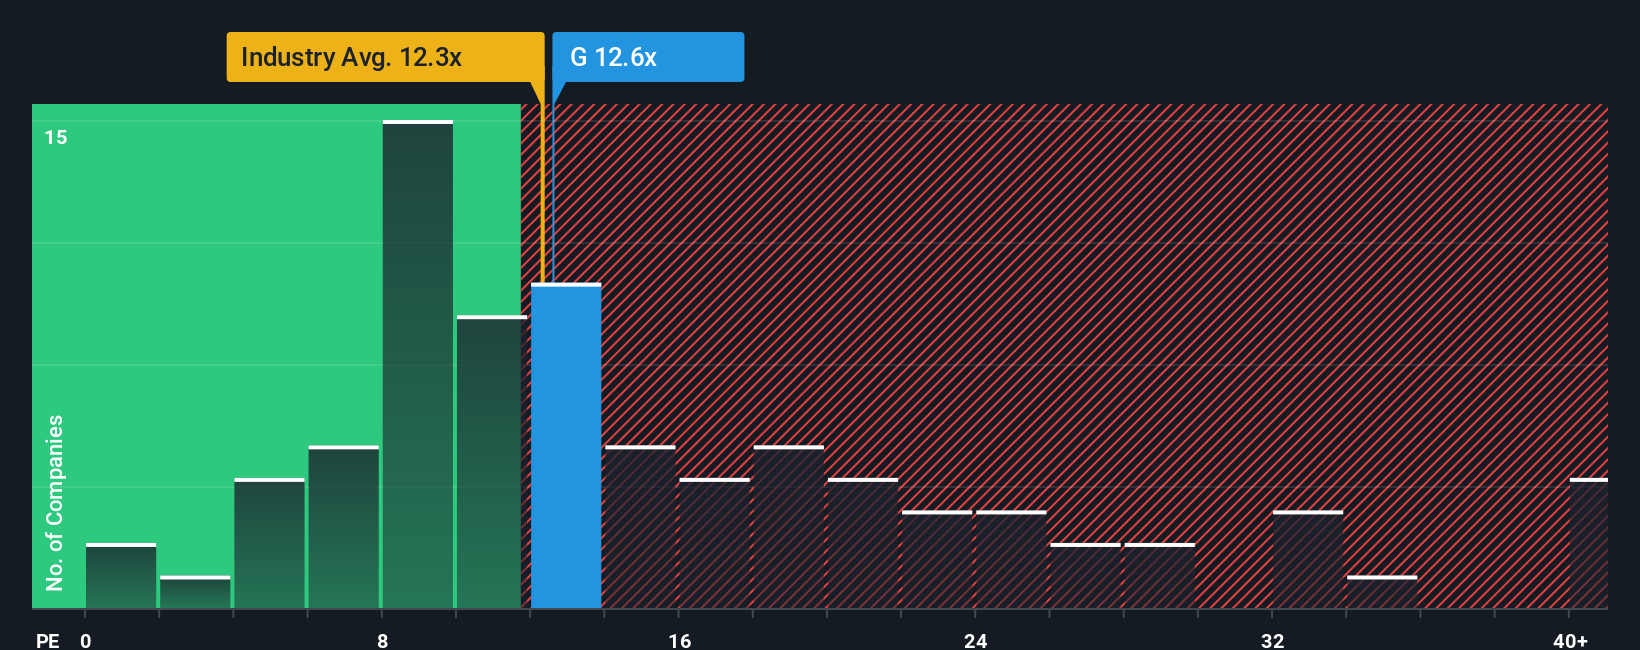
Currently, Assicurazioni Generali trades at a PE of 13.0x. This is slightly above the insurance industry average of 12.2x and the average for close peers at 10.7x. At first glance, this might suggest the stock is valued at a modest premium to its sector.
However, the proprietary Fair Ratio developed by Simply Wall St provides a deeper analysis than these averages. By analyzing the company’s specific earnings outlook, profit margins, risk profile, industry, and market cap, the Fair Ratio estimates a “should-be” multiple of 14.4x for Assicurazioni Generali. This method offers a more nuanced valuation than a simple peer or industry comparison, as it is tailored to the company’s actual fundamentals and prospects.
With the current PE of 13.0x just below its Fair Ratio of 14.4x, Assicurazioni Generali appears to be trading at right around its justified value, pointing to a fair price in the market today.
Result: ABOUT RIGHT
Upgrade Your Decision Making: Choose your Assicurazioni Generali Narrative
Earlier we mentioned that there is an even better way to understand valuation, so let us introduce you to Narratives. A Narrative is simply your story or perspective on a company like Assicurazioni Generali, laid out as a set of beliefs about its future, such as fair value, expected revenue, earnings, and margins, all linked to a financial forecast and a resulting price target.
Unlike traditional valuation methods, Narratives let you combine both the numbers and the "why" behind them, making it easy to test your view against others and see how different assumptions play out. Narratives are available for any user right on Simply Wall St’s Community page, where millions of investors share their unique perspectives, whether they expect digital transformation and global expansion to fuel enduring value or cite margin pressures and capital constraints as reasons for a gloomier fair value outlook.
This tool helps you decide whether to buy or sell by showing if the current market price is above or below your fair value, with Narratives automatically updated whenever fresh news, earnings, or macro events come in. For example, one investor may see Assicurazioni Generali as worth €39.0 based on rapid growth and operational improvements, while another sees a more cautious €25.0 due to industry risks and margin pressure, offering a clear and dynamic way to anchor your own decisions.
Do you think there's more to the story for Assicurazioni Generali? Create your own Narrative to let the Community know!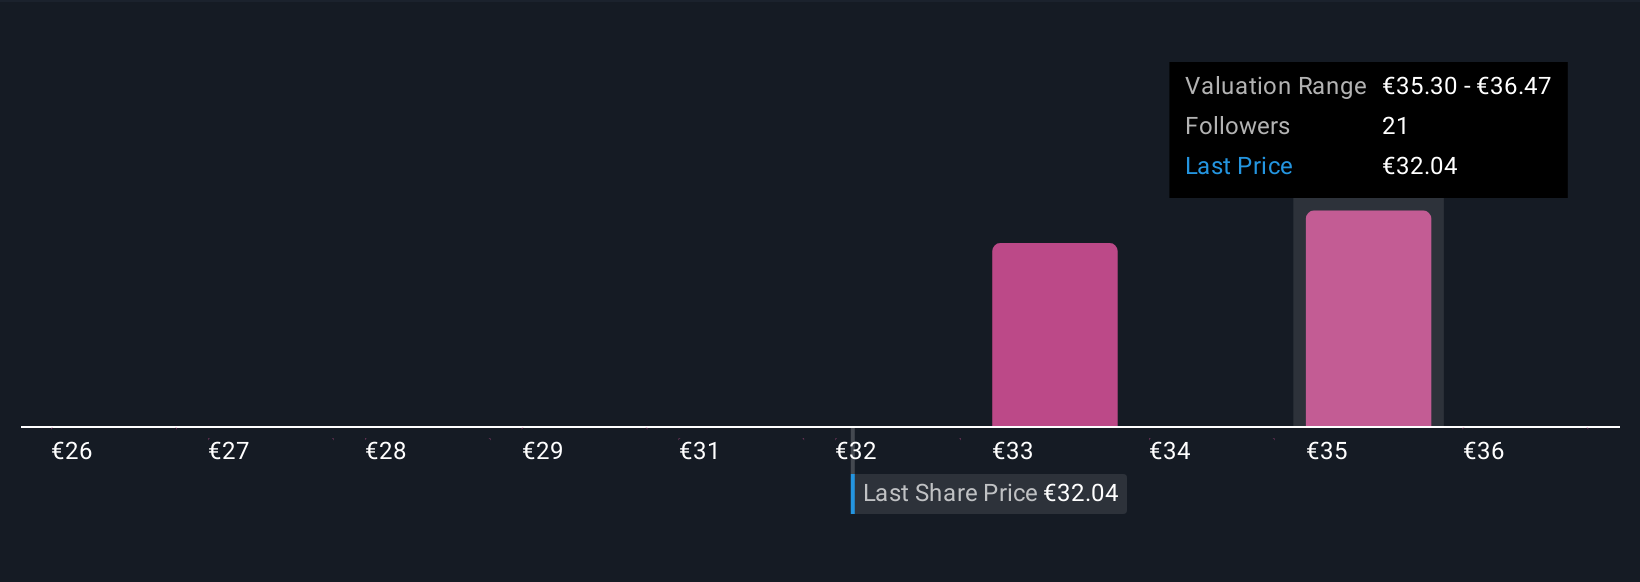
This article by Simply Wall St is general in nature. We provide commentary based on historical data and analyst forecasts only using an unbiased methodology and our articles are not intended to be financial advice. It does not constitute a recommendation to buy or sell any stock, and does not take account of your objectives, or your financial situation. We aim to bring you long-term focused analysis driven by fundamental data. Note that our analysis may not factor in the latest price-sensitive company announcements or qualitative material. Simply Wall St has no position in any stocks mentioned.
New: Manage All Your Stock Portfolios in One Place
We've created the ultimate portfolio companion for stock investors, and it's free.
• Connect an unlimited number of Portfolios and see your total in one currency
• Be alerted to new Warning Signs or Risks via email or mobile
• Track the Fair Value of your stocks
Have feedback on this article? Concerned about the content? Get in touch with us directly. Alternatively, email editorial-team@simplywallst.com
About BIT:G
Assicurazioni Generali
Provides various insurance solutions under the Generali brand in the Americas, Italy, rest of Europe, Africa, the Middle East, Asia, and the Oceania.
Established dividend payer with acceptable track record.
Similar Companies
Market Insights


Advertisement
Community Narratives
The Next Phase of Energy Storage: How NeoVolta Is Tackling America’s Power Crunch
Fair Value US$7.50|39.3% undervalued
MA
Community Contributor
Why EnSilica is Worth Possibly 13x its Current Price
Fair Value UK£5.00|91.8% undervalued
DO
Community Contributor
A case for Cassiar Gold Corp (TSXV: GLDC) to reach CAD$8-10 before 2030 (X30-37)
Fair Value CA$10.00|97.4% undervalued
AG
Community Contributor
M&A Activity, Industry Diversification & A Defense Contract Monopoly Will Push BWXT For Healthy Long-Term Growth
Fair Value US$220.00|17.3% undervalued
CL
Community Contributor