- Italy
- /
- Personal Products
- /
- BIT:KIP
Kolinpharma (BIT:KIP) Is Looking To Continue Growing Its Returns On Capital

If you're not sure where to start when looking for the next multi-bagger, there are a few key trends you should keep an eye out for. Firstly, we'd want to identify a growing return on capital employed (ROCE) and then alongside that, an ever-increasing base of capital employed. This shows us that it's a compounding machine, able to continually reinvest its earnings back into the business and generate higher returns. Speaking of which, we noticed some great changes in Kolinpharma's (BIT:KIP) returns on capital, so let's have a look.
What Is Return On Capital Employed (ROCE)?
For those who don't know, ROCE is a measure of a company's yearly pre-tax profit (its return), relative to the capital employed in the business. Analysts use this formula to calculate it for Kolinpharma:
Return on Capital Employed = Earnings Before Interest and Tax (EBIT) ÷ (Total Assets - Current Liabilities)
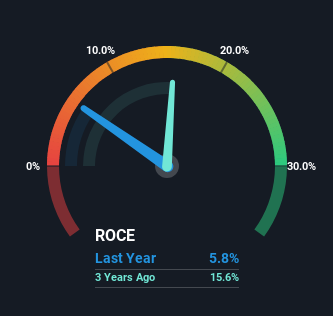
0.058 = €971k ÷ (€22m - €5.3m) (Based on the trailing twelve months to December 2022).
Therefore, Kolinpharma has an ROCE of 5.8%. In absolute terms, that's a low return and it also under-performs the Personal Products industry average of 12%.
Check out our latest analysis for Kolinpharma
Above you can see how the current ROCE for Kolinpharma compares to its prior returns on capital, but there's only so much you can tell from the past. If you're interested, you can view the analysts predictions in our free report on analyst forecasts for the company.
SWOT Analysis for Kolinpharma
- Debt is not viewed as a risk.
- Earnings declined over the past year.
- Current share price is above our estimate of fair value.
- Annual revenue is forecast to grow faster than the Italian market.
- No apparent threats visible for KIP.
What Can We Tell From Kolinpharma's ROCE Trend?
Even though ROCE is still low in absolute terms, it's good to see it's heading in the right direction. The numbers show that in the last five years, the returns generated on capital employed have grown considerably to 5.8%. The company is effectively making more money per dollar of capital used, and it's worth noting that the amount of capital has increased too, by 562%. So we're very much inspired by what we're seeing at Kolinpharma thanks to its ability to profitably reinvest capital.
On a related note, the company's ratio of current liabilities to total assets has decreased to 24%, which basically reduces it's funding from the likes of short-term creditors or suppliers. This tells us that Kolinpharma has grown its returns without a reliance on increasing their current liabilities, which we're very happy with.
What We Can Learn From Kolinpharma's ROCE
In summary, it's great to see that Kolinpharma can compound returns by consistently reinvesting capital at increasing rates of return, because these are some of the key ingredients of those highly sought after multi-baggers. Since the stock has only returned 32% to shareholders over the last five years, the promising fundamentals may not be recognized yet by investors. So exploring more about this stock could uncover a good opportunity, if the valuation and other metrics stack up.
One more thing to note, we've identified 2 warning signs with Kolinpharma and understanding them should be part of your investment process.
While Kolinpharma isn't earning the highest return, check out this free list of companies that are earning high returns on equity with solid balance sheets.
Mobile Infrastructure for Defense and Disaster
The next wave in robotics isn't humanoid. Its fully autonomous towers delivering 5G, ISR, and radar in under 30 minutes, anywhere.
Get the investor briefing before the next round of contracts
Sponsored On Behalf of CiTechValuation is complex, but we're here to simplify it.
Discover if Kolinpharma might be undervalued or overvalued with our detailed analysis, featuring fair value estimates, potential risks, dividends, insider trades, and its financial condition.
Access Free AnalysisHave feedback on this article? Concerned about the content? Get in touch with us directly. Alternatively, email editorial-team (at) simplywallst.com.
This article by Simply Wall St is general in nature. We provide commentary based on historical data and analyst forecasts only using an unbiased methodology and our articles are not intended to be financial advice. It does not constitute a recommendation to buy or sell any stock, and does not take account of your objectives, or your financial situation. We aim to bring you long-term focused analysis driven by fundamental data. Note that our analysis may not factor in the latest price-sensitive company announcements or qualitative material. Simply Wall St has no position in any stocks mentioned.
About BIT:KIP
Kolinpharma
Kolinpharma S.p.A. operates as a nutraceuticals company in Italy.
Flawless balance sheet with questionable track record.
Market Insights

Weekly Picks

THE KINGDOM OF BROWN GOODS: WHY MGPI IS BEING CRUSHED BY INVENTORY & PRIMED FOR RESURRECTION


Why Vertical Aerospace (NYSE: EVTL) is Worth Possibly Over 13x its Current Price


The Quiet Giant That Became AI’s Power Grid
Recently Updated Narratives


MINISO's fair value is projected at 26.69 with an anticipated PE ratio shift of 20x

Fiverr International will transform the freelance industry with AI-powered growth

Stride Stock: Online Education Finds Its Second Act
Popular Narratives


MicroVision will explode future revenue by 380.37% with a vision towards success


Crazy Undervalued 42 Baggers Silver Play (Active & Running Mine)


