- Italy
- /
- Capital Markets
- /
- BIT:EQUI
February 2025 Penny Stocks With Promising Prospects

Reviewed by Simply Wall St

Global markets have been experiencing a dynamic period, with U.S. stock indexes nearing record highs and inflation data influencing interest rate expectations. Amid these broader market movements, the appeal of penny stocks remains noteworthy for investors seeking opportunities in smaller or newer companies that offer growth potential at lower price points. While the term "penny stocks" may seem outdated, these investments continue to hold promise when backed by strong financials and sound fundamentals.
Top 10 Penny Stocks
| Name | Share Price | Market Cap | Financial Health Rating |
| DXN Holdings Bhd (KLSE:DXN) | MYR0.52 | MYR2.59B | ★★★★★★ |
| Bosideng International Holdings (SEHK:3998) | HK$3.90 | HK$44.77B | ★★★★★★ |
| Warpaint London (AIM:W7L) | £3.95 | £327.19M | ★★★★★★ |
| Begbies Traynor Group (AIM:BEG) | £0.96 | £150.13M | ★★★★★★ |
| Datasonic Group Berhad (KLSE:DSONIC) | MYR0.335 | MYR932.02M | ★★★★★★ |
| Polar Capital Holdings (AIM:POLR) | £4.855 | £469.93M | ★★★★★★ |
| Hil Industries Berhad (KLSE:HIL) | MYR0.855 | MYR283.81M | ★★★★★★ |
| Foresight Group Holdings (LSE:FSG) | £3.95 | £448.86M | ★★★★★★ |
| Embark Early Education (ASX:EVO) | A$0.80 | A$146.79M | ★★★★☆☆ |
| Next 15 Group (AIM:NFG) | £3.09 | £305.33M | ★★★★☆☆ |
Click here to see the full list of 5,687 stocks from our Penny Stocks screener.
We'll examine a selection from our screener results.
Equita Group (BIT:EQUI)
Simply Wall St Financial Health Rating: ★★★★☆☆
Overview: Equita Group S.p.A. operates in sales and trading, investment banking, and alternative asset management services for a diverse clientele including investors, financial institutions, corporates, and entrepreneurs both in Italy and internationally, with a market cap of €220.47 million.
Operations: The company's revenue is primarily derived from Global Markets (€41.78 million), Investment Banking (€32.08 million), and Other Asset Management, specifically portfolio management (€9.87 million).
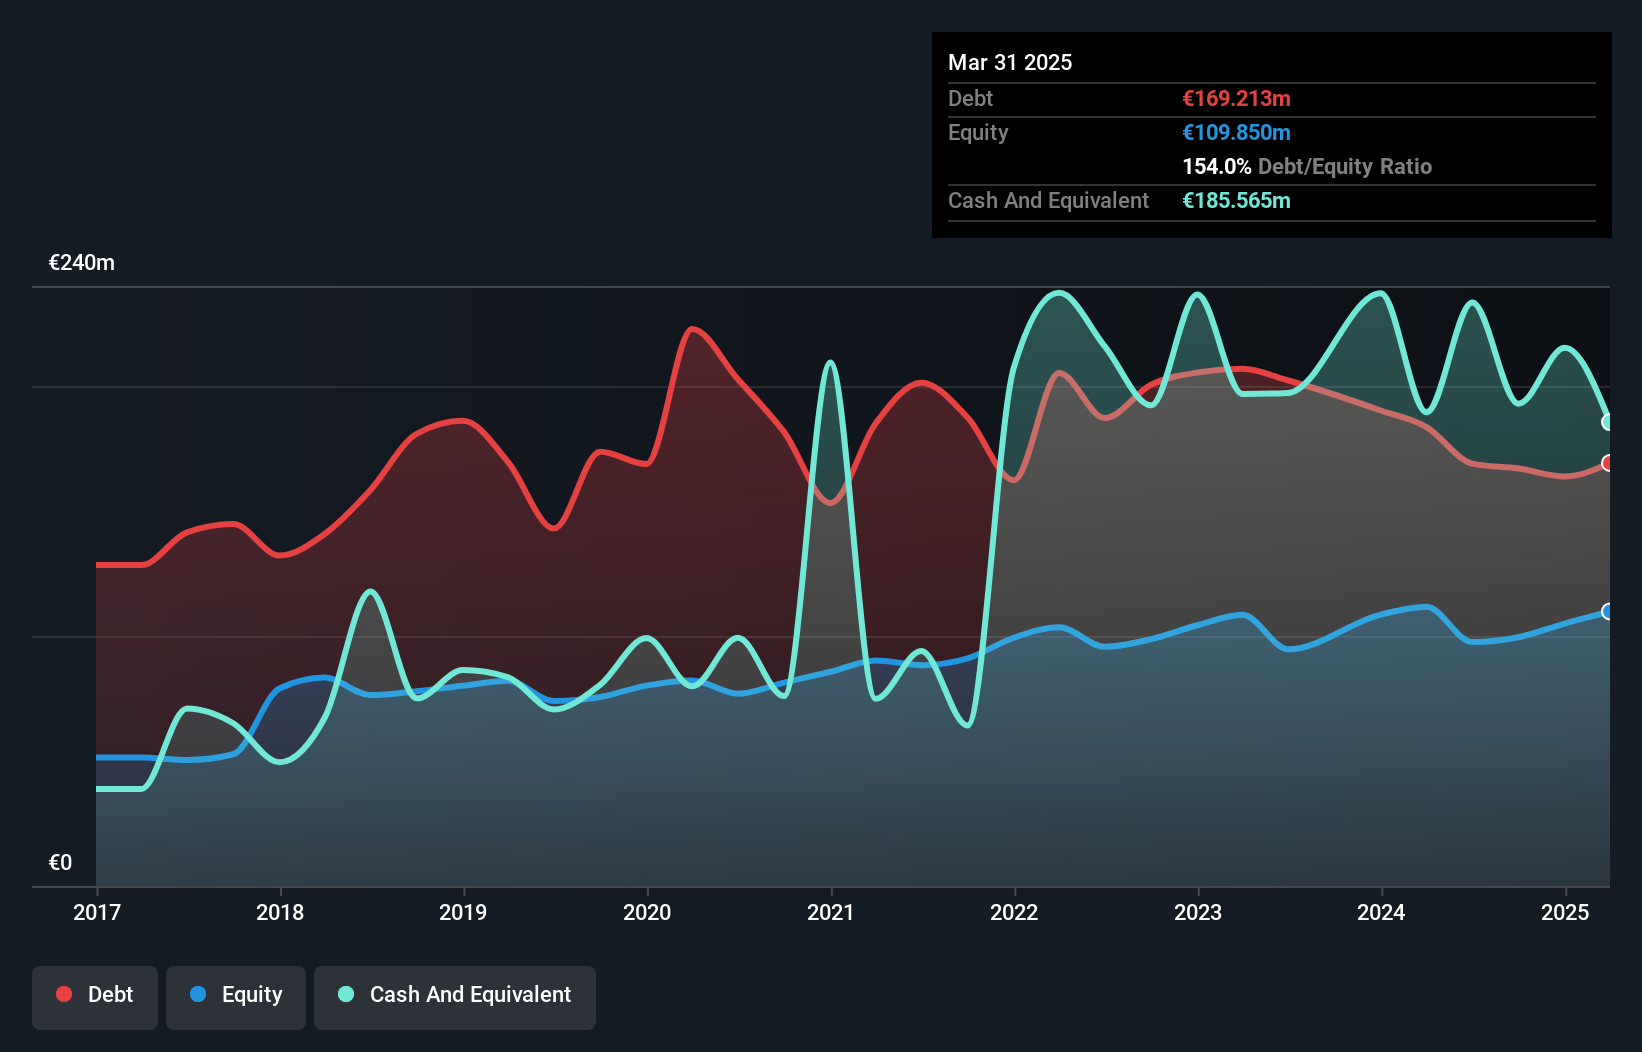
Market Cap: €220.47M
Equita Group S.p.A., with a market cap of €220.47 million, operates in sales and trading, investment banking, and alternative asset management. The company has shown consistent earnings growth over the past five years at 7.9% annually, with a notable acceleration to 36.5% last year. Despite this growth, its Return on Equity is considered low at 16.4%. Debt levels have improved significantly from five years ago but remain inadequately covered by operating cash flow (8.9%). While its dividend yield of 7.81% is attractive, it isn't well supported by earnings or free cash flows, indicating potential sustainability concerns.
- Jump into the full analysis health report here for a deeper understanding of Equita Group.
- Gain insights into Equita Group's outlook and expected performance with our report on the company's earnings estimates.
Yeebo (International Holdings) (SEHK:259)
Simply Wall St Financial Health Rating: ★★★★★☆
Overview: Yeebo (International Holdings) Limited is an investment holding company involved in the manufacture and sale of liquid crystal display (LCD) and liquid crystal display module (LCM) products, with a market cap of HK$1.58 billion.
Operations: The company generates revenue primarily from its Displays and Other Services segment, amounting to HK$949.16 million.
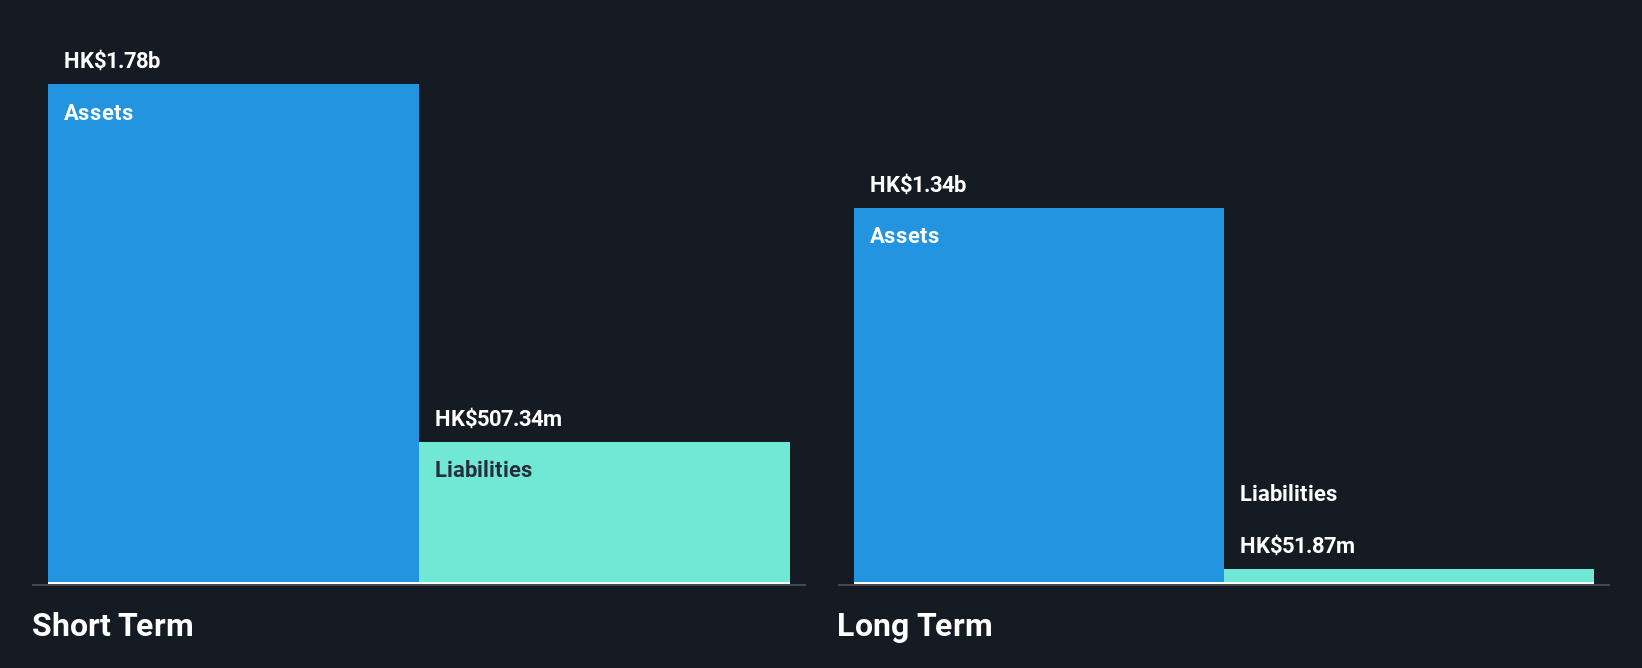
Market Cap: HK$1.58B
Yeebo (International Holdings) Limited, with a market cap of HK$1.58 billion, recently declared a special dividend of HKD 1.8 per share, reflecting its commitment to shareholder returns despite challenges. The company has more cash than total debt and short-term assets exceeding liabilities, indicating strong financial health. However, profit margins have declined from 38.9% to 16%, and earnings growth has been negative over the past year at -64.6%. While interest payments are well covered and the board is seasoned with an average tenure of 17.4 years, volatility remains high in recent months, posing potential risks for investors.
- Click to explore a detailed breakdown of our findings in Yeebo (International Holdings)'s financial health report.
- Evaluate Yeebo (International Holdings)'s historical performance by accessing our past performance report.
Shenzhen Asia Link Technology DevelopmentLtd (SZSE:002316)
Simply Wall St Financial Health Rating: ★★★★★☆
Overview: Shenzhen Asia Link Technology Development Co., Ltd. operates in the technology sector and has a market capitalization of CN¥1.43 billion.
Operations: Shenzhen Asia Link Technology Development Co., Ltd. has not reported any specific revenue segments at this time.
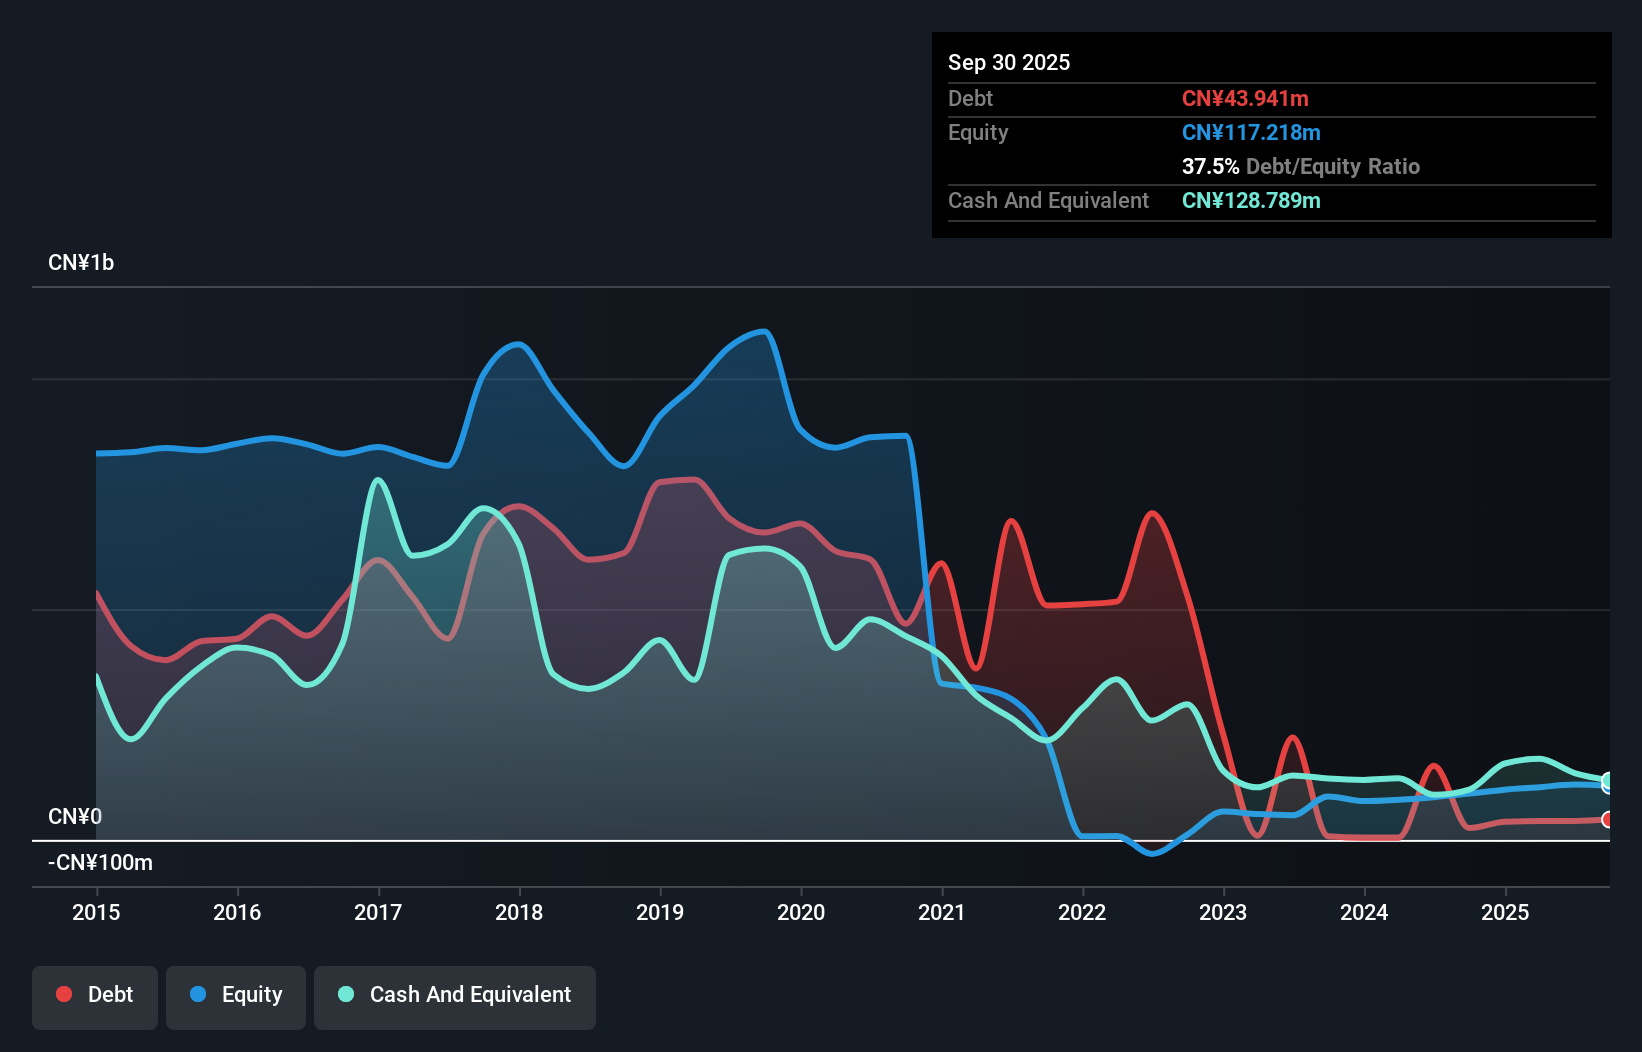
Market Cap: CN¥1.43B
Shenzhen Asia Link Technology Development Co., Ltd. has a market cap of CN¥1.43 billion and operates with more cash than debt, indicating a solid financial position despite being pre-revenue. The company has successfully reduced its debt-to-equity ratio from 60.5% to 25.5% over the past five years while maintaining a stable weekly volatility of 5%. Although unprofitable, it has decreased losses by 24.7% annually over the same period, demonstrating progress toward profitability. Its experienced management team and board support strategic decision-making, but short-term assets slightly fall short of covering liabilities, presenting potential liquidity challenges.
- Unlock comprehensive insights into our analysis of Shenzhen Asia Link Technology DevelopmentLtd stock in this financial health report.
- Understand Shenzhen Asia Link Technology DevelopmentLtd's track record by examining our performance history report.
Taking Advantage
- Embark on your investment journey to our 5,687 Penny Stocks selection here.
- Got skin in the game with these stocks? Elevate how you manage them by using Simply Wall St's portfolio, where intuitive tools await to help optimize your investment outcomes.
- Simply Wall St is a revolutionary app designed for long-term stock investors, it's free and covers every market in the world.
Ready For A Different Approach?
- Explore high-performing small cap companies that haven't yet garnered significant analyst attention.
- Jump on the AI train with fast growing tech companies forging a new era of innovation.
- Find companies with promising cash flow potential yet trading below their fair value.
This article by Simply Wall St is general in nature. We provide commentary based on historical data and analyst forecasts only using an unbiased methodology and our articles are not intended to be financial advice. It does not constitute a recommendation to buy or sell any stock, and does not take account of your objectives, or your financial situation. We aim to bring you long-term focused analysis driven by fundamental data. Note that our analysis may not factor in the latest price-sensitive company announcements or qualitative material. Simply Wall St has no position in any stocks mentioned.
Valuation is complex, but we're here to simplify it.
Discover if Equita Group might be undervalued or overvalued with our detailed analysis, featuring fair value estimates, potential risks, dividends, insider trades, and its financial condition.
Access Free AnalysisHave feedback on this article? Concerned about the content? Get in touch with us directly. Alternatively, email editorial-team@simplywallst.com
About BIT:EQUI
Equita Group
Provides sales and trading, investment banking, and alternative asset management services for investors, financial institution, corporates, and entrepreneurs in Italy and internationally.
Reasonable growth potential with proven track record.
Market Insights

Community Narratives

