- Italy
- /
- Construction
- /
- BIT:TFIN
Does TREVI - Finanziaria Industriale (BIT:TFI) Have A Healthy Balance Sheet?


David Iben put it well when he said, 'Volatility is not a risk we care about. What we care about is avoiding the permanent loss of capital.' So it might be obvious that you need to consider debt, when you think about how risky any given stock is, because too much debt can sink a company. We can see that TREVI - Finanziaria Industriale S.p.A. (BIT:TFI) does use debt in its business. But should shareholders be worried about its use of debt?
What Risk Does Debt Bring?
Debt assists a business until the business has trouble paying it off, either with new capital or with free cash flow. Part and parcel of capitalism is the process of 'creative destruction' where failed businesses are mercilessly liquidated by their bankers. However, a more common (but still painful) scenario is that it has to raise new equity capital at a low price, thus permanently diluting shareholders. Of course, plenty of companies use debt to fund growth, without any negative consequences. When we think about a company's use of debt, we first look at cash and debt together.
View our latest analysis for TREVI - Finanziaria Industriale
What Is TREVI - Finanziaria Industriale's Debt?
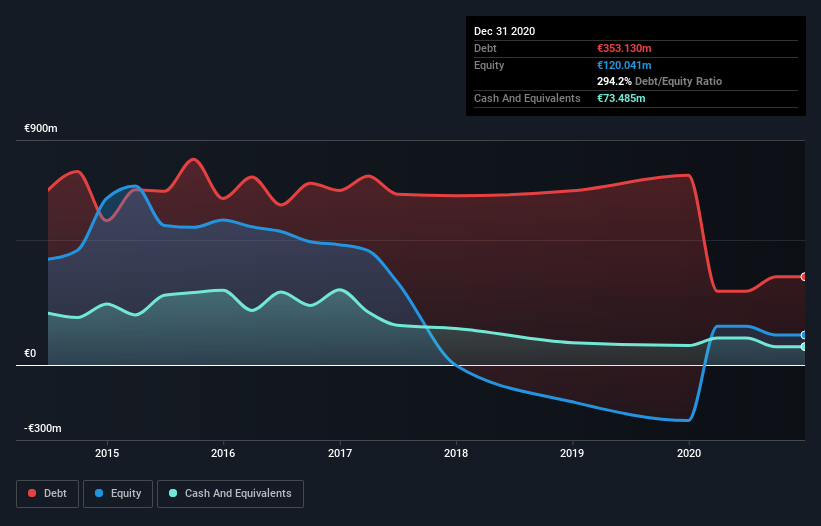
You can click the graphic below for the historical numbers, but it shows that TREVI - Finanziaria Industriale had €277.6m of debt in December 2020, down from €758.9m, one year before. However, it does have €73.5m in cash offsetting this, leading to net debt of about €204.2m.
A Look At TREVI - Finanziaria Industriale's Liabilities
We can see from the most recent balance sheet that TREVI - Finanziaria Industriale had liabilities of €430.4m falling due within a year, and liabilities of €140.3m due beyond that. Offsetting this, it had €73.5m in cash and €247.4m in receivables that were due within 12 months. So its liabilities outweigh the sum of its cash and (near-term) receivables by €249.8m.
When you consider that this deficiency exceeds the company's €187.1m market capitalization, you might well be inclined to review the balance sheet intently. In the scenario where the company had to clean up its balance sheet quickly, it seems likely shareholders would suffer extensive dilution.
We use two main ratios to inform us about debt levels relative to earnings. The first is net debt divided by earnings before interest, tax, depreciation, and amortization (EBITDA), while the second is how many times its earnings before interest and tax (EBIT) covers its interest expense (or its interest cover, for short). Thus we consider debt relative to earnings both with and without depreciation and amortization expenses.
While TREVI - Finanziaria Industriale's debt to EBITDA ratio (4.0) suggests that it uses some debt, its interest cover is very weak, at 0.28, suggesting high leverage. It seems that the business incurs large depreciation and amortisation charges, so maybe its debt load is heavier than it would first appear, since EBITDA is arguably a generous measure of earnings. It seems clear that the cost of borrowing money is negatively impacting returns for shareholders, of late. One redeeming factor for TREVI - Finanziaria Industriale is that it turned last year's EBIT loss into a gain of €5.3m, over the last twelve months. When analysing debt levels, the balance sheet is the obvious place to start. But ultimately the future profitability of the business will decide if TREVI - Finanziaria Industriale can strengthen its balance sheet over time. So if you're focused on the future you can check out this free report showing analyst profit forecasts.
Finally, a company can only pay off debt with cold hard cash, not accounting profits. So it's worth checking how much of the earnings before interest and tax (EBIT) is backed by free cash flow. Considering the last year, TREVI - Finanziaria Industriale actually recorded a cash outflow, overall. Debt is usually more expensive, and almost always more risky in the hands of a company with negative free cash flow. Shareholders ought to hope for an improvement.
Our View
On the face of it, TREVI - Finanziaria Industriale's level of total liabilities left us tentative about the stock, and its interest cover was no more enticing than the one empty restaurant on the busiest night of the year. But at least its EBIT growth rate is not so bad. After considering the datapoints discussed, we think TREVI - Finanziaria Industriale has too much debt. While some investors love that sort of risky play, it's certainly not our cup of tea. The balance sheet is clearly the area to focus on when you are analysing debt. But ultimately, every company can contain risks that exist outside of the balance sheet. We've identified 3 warning signs with TREVI - Finanziaria Industriale , and understanding them should be part of your investment process.
When all is said and done, sometimes its easier to focus on companies that don't even need debt. Readers can access a list of growth stocks with zero net debt 100% free, right now.
If you decide to trade TREVI - Finanziaria Industriale, use the lowest-cost* platform that is rated #1 Overall by Barron’s, Interactive Brokers. Trade stocks, options, futures, forex, bonds and funds on 135 markets, all from a single integrated account. Promoted
Valuation is complex, but we're here to simplify it.
Discover if TREVI - Finanziaria Industriale might be undervalued or overvalued with our detailed analysis, featuring fair value estimates, potential risks, dividends, insider trades, and its financial condition.
Access Free AnalysisThis article by Simply Wall St is general in nature. It does not constitute a recommendation to buy or sell any stock, and does not take account of your objectives, or your financial situation. We aim to bring you long-term focused analysis driven by fundamental data. Note that our analysis may not factor in the latest price-sensitive company announcements or qualitative material. Simply Wall St has no position in any stocks mentioned.
*Interactive Brokers Rated Lowest Cost Broker by StockBrokers.com Annual Online Review 2020
Have feedback on this article? Concerned about the content? Get in touch with us directly. Alternatively, email editorial-team (at) simplywallst.com.
About BIT:TFIN
Adequate balance sheet with moderate growth potential.
Market Insights

Community Narratives


