Costamp Group (BIT:MOLD) Could Be Struggling To Allocate Capital


To find a multi-bagger stock, what are the underlying trends we should look for in a business? In a perfect world, we'd like to see a company investing more capital into its business and ideally the returns earned from that capital are also increasing. Put simply, these types of businesses are compounding machines, meaning they are continually reinvesting their earnings at ever-higher rates of return. Having said that, from a first glance at Costamp Group (BIT:MOLD) we aren't jumping out of our chairs at how returns are trending, but let's have a deeper look.
What is Return On Capital Employed (ROCE)?
For those that aren't sure what ROCE is, it measures the amount of pre-tax profits a company can generate from the capital employed in its business. The formula for this calculation on Costamp Group is:
Return on Capital Employed = Earnings Before Interest and Tax (EBIT) ÷ (Total Assets - Current Liabilities)
0.026 = €1.5m ÷ (€98m - €40m) (Based on the trailing twelve months to December 2020).
Thus, Costamp Group has an ROCE of 2.6%. In absolute terms, that's a low return and it also under-performs the Machinery industry average of 8.7%.
View our latest analysis for Costamp Group
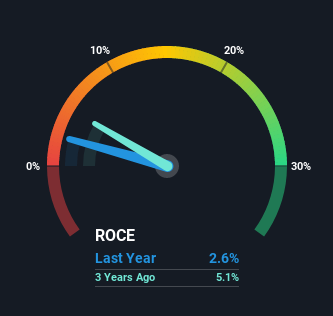
Historical performance is a great place to start when researching a stock so above you can see the gauge for Costamp Group's ROCE against it's prior returns. If you want to delve into the historical earnings, revenue and cash flow of Costamp Group, check out these free graphs here.
What Does the ROCE Trend For Costamp Group Tell Us?
In terms of Costamp Group's historical ROCE movements, the trend isn't fantastic. Around five years ago the returns on capital were 9.3%, but since then they've fallen to 2.6%. Given the business is employing more capital while revenue has slipped, this is a bit concerning. If this were to continue, you might be looking at a company that is trying to reinvest for growth but is actually losing market share since sales haven't increased.
On a side note, Costamp Group has done well to pay down its current liabilities to 41% of total assets. So we could link some of this to the decrease in ROCE. What's more, this can reduce some aspects of risk to the business because now the company's suppliers or short-term creditors are funding less of its operations. Since the business is basically funding more of its operations with it's own money, you could argue this has made the business less efficient at generating ROCE. Keep in mind 41% is still pretty high, so those risks are still somewhat prevalent.
In Conclusion...
We're a bit apprehensive about Costamp Group because despite more capital being deployed in the business, returns on that capital and sales have both fallen. We expect this has contributed to the stock plummeting 75% during the last three years. That being the case, unless the underlying trends revert to a more positive trajectory, we'd consider looking elsewhere.
If you want to know some of the risks facing Costamp Group we've found 4 warning signs (2 can't be ignored!) that you should be aware of before investing here.
If you want to search for solid companies with great earnings, check out this free list of companies with good balance sheets and impressive returns on equity.
If you're looking to trade Costamp Group, open an account with the lowest-cost platform trusted by professionals, Interactive Brokers.
With clients in over 200 countries and territories, and access to 160 markets, IBKR lets you trade stocks, options, futures, forex, bonds and funds from a single integrated account.
Enjoy no hidden fees, no account minimums, and FX conversion rates as low as 0.03%, far better than what most brokers offer.
Sponsored ContentNew: AI Stock Screener & Alerts
Our new AI Stock Screener scans the market every day to uncover opportunities.
• Dividend Powerhouses (3%+ Yield)
• Undervalued Small Caps with Insider Buying
• High growth Tech and AI Companies
Or build your own from over 50 metrics.
This article by Simply Wall St is general in nature. We provide commentary based on historical data and analyst forecasts only using an unbiased methodology and our articles are not intended to be financial advice. It does not constitute a recommendation to buy or sell any stock, and does not take account of your objectives, or your financial situation. We aim to bring you long-term focused analysis driven by fundamental data. Note that our analysis may not factor in the latest price-sensitive company announcements or qualitative material. Simply Wall St has no position in any stocks mentioned.
Have feedback on this article? Concerned about the content? Get in touch with us directly. Alternatively, email editorial-team (at) simplywallst.com.
About BIT:MOLD
Costamp Group
Costamp Group S.p.A. manufactures and sells casting dies for automotive and industrial applications.
Undervalued with proven track record.
Similar Companies
Market Insights

Community Narratives


