
Advertisement
- Italy
- /
- Trade Distributors
- /
- BIT:GG
Risks Still Elevated At These Prices As Giglio Group S.p.A. (BIT:GG) Shares Dive 25%
Giglio Group S.p.A. (BIT:GG) shares have retraced a considerable 25% in the last month, reversing a fair amount of their solid recent performance. Instead of being rewarded, shareholders who have already held through the last twelve months are now sitting on a 25% share price drop.
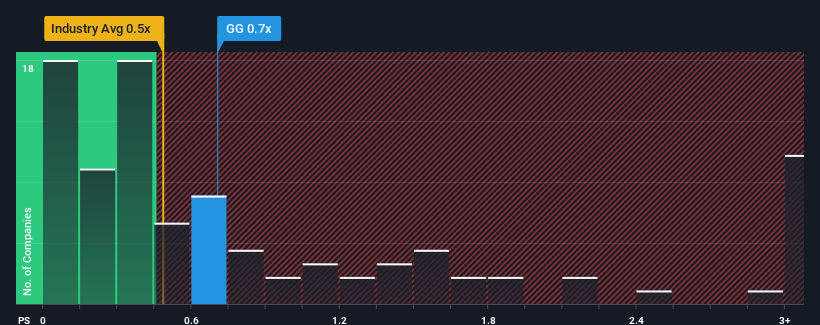
Although its price has dipped substantially, you could still be forgiven for feeling indifferent about Giglio Group's P/S ratio of 0.7x, since the median price-to-sales (or "P/S") ratio for the Trade Distributors industry in Italy is also close to 0.5x. While this might not raise any eyebrows, if the P/S ratio is not justified investors could be missing out on a potential opportunity or ignoring looming disappointment.
Check out our latest analysis for Giglio Group
How Giglio Group Has Been Performing
The revenue growth achieved at Giglio Group over the last year would be more than acceptable for most companies. It might be that many expect the respectable revenue performance to wane, which has kept the P/S from rising. If you like the company, you'd be hoping this isn't the case so that you could potentially pick up some stock while it's not quite in favour.
Want the full picture on earnings, revenue and cash flow for the company? Then our free report on Giglio Group will help you shine a light on its historical performance.Do Revenue Forecasts Match The P/S Ratio?
Giglio Group's P/S ratio would be typical for a company that's only expected to deliver moderate growth, and importantly, perform in line with the industry.
Taking a look back first, we see that the company managed to grow revenues by a handy 7.7% last year. However, this wasn't enough as the latest three year period has seen an unpleasant 49% overall drop in revenue. Therefore, it's fair to say the revenue growth recently has been undesirable for the company.
In contrast to the company, the rest of the industry is expected to grow by 6.5% over the next year, which really puts the company's recent medium-term revenue decline into perspective.
With this in mind, we find it worrying that Giglio Group's P/S exceeds that of its industry peers. It seems most investors are ignoring the recent poor growth rate and are hoping for a turnaround in the company's business prospects. There's a good chance existing shareholders are setting themselves up for future disappointment if the P/S falls to levels more in line with the recent negative growth rates.
The Key Takeaway
With its share price dropping off a cliff, the P/S for Giglio Group looks to be in line with the rest of the Trade Distributors industry. It's argued the price-to-sales ratio is an inferior measure of value within certain industries, but it can be a powerful business sentiment indicator.
We find it unexpected that Giglio Group trades at a P/S ratio that is comparable to the rest of the industry, despite experiencing declining revenues during the medium-term, while the industry as a whole is expected to grow. When we see revenue heading backwards in the context of growing industry forecasts, it'd make sense to expect a possible share price decline on the horizon, sending the moderate P/S lower. Unless the the circumstances surrounding the recent medium-term improve, it wouldn't be wrong to expect a a difficult period ahead for the company's shareholders.
Before you settle on your opinion, we've discovered 3 warning signs for Giglio Group (2 shouldn't be ignored!) that you should be aware of.
If strong companies turning a profit tickle your fancy, then you'll want to check out this free list of interesting companies that trade on a low P/E (but have proven they can grow earnings).
New: Manage All Your Stock Portfolios in One Place
We've created the ultimate portfolio companion for stock investors, and it's free.
• Connect an unlimited number of Portfolios and see your total in one currency
• Be alerted to new Warning Signs or Risks via email or mobile
• Track the Fair Value of your stocks
Have feedback on this article? Concerned about the content? Get in touch with us directly. Alternatively, email editorial-team (at) simplywallst.com.
This article by Simply Wall St is general in nature. We provide commentary based on historical data and analyst forecasts only using an unbiased methodology and our articles are not intended to be financial advice. It does not constitute a recommendation to buy or sell any stock, and does not take account of your objectives, or your financial situation. We aim to bring you long-term focused analysis driven by fundamental data. Note that our analysis may not factor in the latest price-sensitive company announcements or qualitative material. Simply Wall St has no position in any stocks mentioned.
About BIT:GG
Giglio Group
Designs, creates, and manages e-commerce platforms for fashion, design, lifestyle and food and healthcare sectors in Italy and internationally.
Low risk with weak fundamentals.
Market Insights

Advertisement
Community Narratives
A formidable player in AI and enterprise computing.
Fair Value US$210.00|12.2% overvalued
CO
Community Contributor
IREN's Bold Moves in Sustainable Bitcoin Mining & AI Data Centers
Fair Value US$72.52|17.1% undervalued
BL
Community Contributor
Cooling the Champions: The Aussie Tech Behind F1's Victories
Fair Value AU$12.40|38.7% undervalued
TR
Community Contributor