Fincantieri S.p.A. (BIT:FCT) Stock Rockets 26% But Many Are Still Ignoring The Company


Those holding Fincantieri S.p.A. (BIT:FCT) shares would be relieved that the share price has rebounded 26% in the last thirty days, but it needs to keep going to repair the recent damage it has caused to investor portfolios. Notwithstanding the latest gain, the annual share price return of 9.9% isn't as impressive.
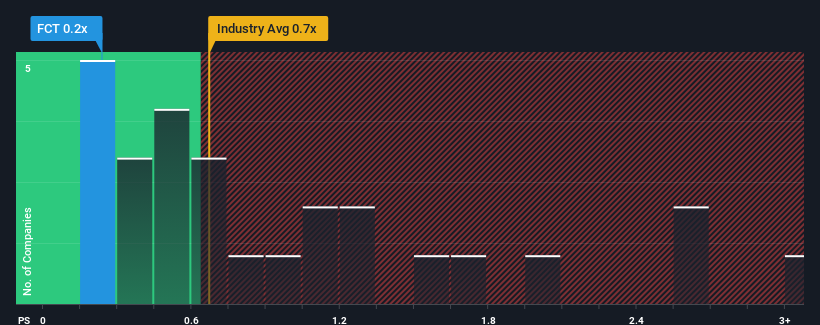
In spite of the firm bounce in price, it's still not a stretch to say that Fincantieri's price-to-sales (or "P/S") ratio of 0.2x right now seems quite "middle-of-the-road" compared to the Machinery industry in Italy, where the median P/S ratio is around 0.7x. While this might not raise any eyebrows, if the P/S ratio is not justified investors could be missing out on a potential opportunity or ignoring looming disappointment.
See our latest analysis for Fincantieri
How Fincantieri Has Been Performing
Recent revenue growth for Fincantieri has been in line with the industry. It seems that many are expecting the mediocre revenue performance to persist, which has held the P/S ratio back. If you like the company, you'd be hoping this can at least be maintained so that you could pick up some stock while it's not quite in favour.
Want the full picture on analyst estimates for the company? Then our free report on Fincantieri will help you uncover what's on the horizon.Is There Some Revenue Growth Forecasted For Fincantieri?
There's an inherent assumption that a company should be matching the industry for P/S ratios like Fincantieri's to be considered reasonable.
Retrospectively, the last year delivered virtually the same number to the company's top line as the year before. Still, the latest three year period was better as it's delivered a decent 19% overall rise in revenue. Therefore, it's fair to say that revenue growth has been inconsistent recently for the company.
Shifting to the future, estimates from the six analysts covering the company suggest revenue should grow by 10% over the next year. With the industry only predicted to deliver 2.9%, the company is positioned for a stronger revenue result.
In light of this, it's curious that Fincantieri's P/S sits in line with the majority of other companies. Apparently some shareholders are skeptical of the forecasts and have been accepting lower selling prices.
What Does Fincantieri's P/S Mean For Investors?
Fincantieri appears to be back in favour with a solid price jump bringing its P/S back in line with other companies in the industry While the price-to-sales ratio shouldn't be the defining factor in whether you buy a stock or not, it's quite a capable barometer of revenue expectations.
We've established that Fincantieri currently trades on a lower than expected P/S since its forecasted revenue growth is higher than the wider industry. There could be some risks that the market is pricing in, which is preventing the P/S ratio from matching the positive outlook. It appears some are indeed anticipating revenue instability, because these conditions should normally provide a boost to the share price.
Don't forget that there may be other risks. For instance, we've identified 2 warning signs for Fincantieri (1 is a bit unpleasant) you should be aware of.
It's important to make sure you look for a great company, not just the first idea you come across. So if growing profitability aligns with your idea of a great company, take a peek at this free list of interesting companies with strong recent earnings growth (and a low P/E).
New: AI Stock Screener & Alerts
Our new AI Stock Screener scans the market every day to uncover opportunities.
• Dividend Powerhouses (3%+ Yield)
• Undervalued Small Caps with Insider Buying
• High growth Tech and AI Companies
Or build your own from over 50 metrics.
Have feedback on this article? Concerned about the content? Get in touch with us directly. Alternatively, email editorial-team (at) simplywallst.com.
This article by Simply Wall St is general in nature. We provide commentary based on historical data and analyst forecasts only using an unbiased methodology and our articles are not intended to be financial advice. It does not constitute a recommendation to buy or sell any stock, and does not take account of your objectives, or your financial situation. We aim to bring you long-term focused analysis driven by fundamental data. Note that our analysis may not factor in the latest price-sensitive company announcements or qualitative material. Simply Wall St has no position in any stocks mentioned.
Have feedback on this article? Concerned about the content? Get in touch with us directly. Alternatively, email editorial-team@simplywallst.com
About BIT:FCT
Undervalued with reasonable growth potential.
