Fincantieri (BIT:FCT investor five-year losses grow to 38% as the stock sheds €59m this past week


The main aim of stock picking is to find the market-beating stocks. But every investor is virtually certain to have both over-performing and under-performing stocks. At this point some shareholders may be questioning their investment in Fincantieri S.p.A. (BIT:FCT), since the last five years saw the share price fall 52%. Furthermore, it's down 39% in about a quarter. That's not much fun for holders.
With the stock having lost 6.8% in the past week, it's worth taking a look at business performance and seeing if there's any red flags.
Check out our latest analysis for Fincantieri
Fincantieri wasn't profitable in the last twelve months, it is unlikely we'll see a strong correlation between its share price and its earnings per share (EPS). Arguably revenue is our next best option. Shareholders of unprofitable companies usually desire strong revenue growth. That's because it's hard to be confident a company will be sustainable if revenue growth is negligible, and it never makes a profit.
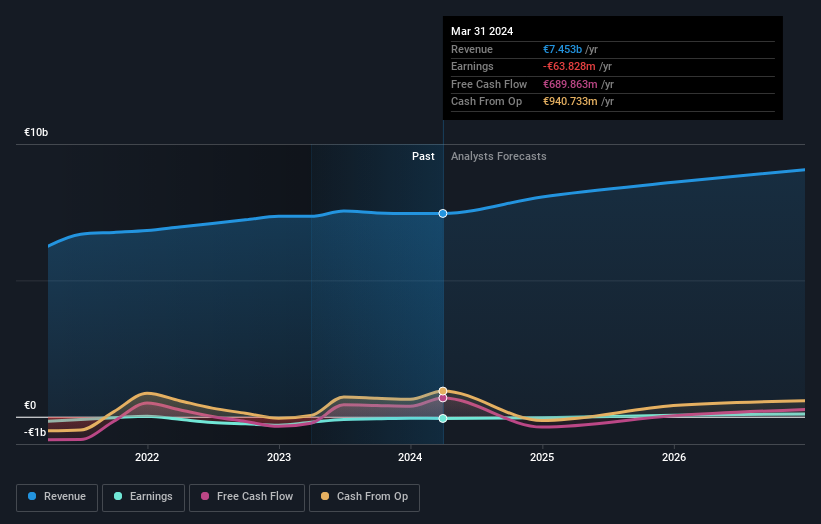
Over five years, Fincantieri grew its revenue at 7.4% per year. That's a fairly respectable growth rate. The share price return isn't so respectable with an annual loss of 9% over the period. That suggests the market is disappointed with the current growth rate. A pessimistic market can create opportunities.
You can see below how earnings and revenue have changed over time (discover the exact values by clicking on the image).
This free interactive report on Fincantieri's balance sheet strength is a great place to start, if you want to investigate the stock further.
What About The Total Shareholder Return (TSR)?
We'd be remiss not to mention the difference between Fincantieri's total shareholder return (TSR) and its share price return. The TSR is a return calculation that accounts for the value of cash dividends (assuming that any dividend received was reinvested) and the calculated value of any discounted capital raisings and spin-offs. Dividends have been really beneficial for Fincantieri shareholders, and that cash payout explains why its total shareholder loss of 38%, over the last 5 years, isn't as bad as the share price return.
A Different Perspective
It's nice to see that Fincantieri shareholders have received a total shareholder return of 26% over the last year. That certainly beats the loss of about 7% per year over the last half decade. This makes us a little wary, but the business might have turned around its fortunes. While it is well worth considering the different impacts that market conditions can have on the share price, there are other factors that are even more important. Case in point: We've spotted 1 warning sign for Fincantieri you should be aware of.
If you would prefer to check out another company -- one with potentially superior financials -- then do not miss this free list of companies that have proven they can grow earnings.
Please note, the market returns quoted in this article reflect the market weighted average returns of stocks that currently trade on Italian exchanges.
New: AI Stock Screener & Alerts
Our new AI Stock Screener scans the market every day to uncover opportunities.
• Dividend Powerhouses (3%+ Yield)
• Undervalued Small Caps with Insider Buying
• High growth Tech and AI Companies
Or build your own from over 50 metrics.
Have feedback on this article? Concerned about the content? Get in touch with us directly. Alternatively, email editorial-team (at) simplywallst.com.
This article by Simply Wall St is general in nature. We provide commentary based on historical data and analyst forecasts only using an unbiased methodology and our articles are not intended to be financial advice. It does not constitute a recommendation to buy or sell any stock, and does not take account of your objectives, or your financial situation. We aim to bring you long-term focused analysis driven by fundamental data. Note that our analysis may not factor in the latest price-sensitive company announcements or qualitative material. Simply Wall St has no position in any stocks mentioned.
Have feedback on this article? Concerned about the content? Get in touch with us directly. Alternatively, email editorial-team@simplywallst.com
About BIT:FCT
Reasonable growth potential and fair value.

