Advertisement
Does Stellantis Offer Opportunity After $10B U.S. Turnaround Plan and Share Price Rally?

Simply Wall St
Reviewed by Bailey Pemberton
Thinking about what to do with Stellantis stock right now? You are not alone. Over the past month, Stellantis has staged an impressive comeback, up 21.7%, with a striking 20.0% gain in just the last week. Yet if you zoom out, things look choppier, with the stock down 25.3% year-to-date and still trailing by 14.3% over the past year. So what is really driving these swings, and does the recent uptick signal a lasting change or just a temporary pop?
Plenty is happening behind the scenes. Stellantis has announced plans to pour $10 billion into a U.S. turnaround, while also navigating the ever-changing landscape of auto tariffs and forging partnerships around electric vehicles with the likes of Nissan. These are the types of moves that get investors to do a double take, reassessing risk and reward. There is also a whiff of optimism that tariff relief could improve profitability for U.S. operations, which matters a lot to Stellantis’s bottom line. When news like this hits, it is not surprising to see sharp moves in the share price as the market recalibrates the company’s outlook.
But what about value? Stellantis currently earns a value score of 5 out of 6, meaning it passes almost every major undervaluation check used by analysts. It is the kind of setup that makes long-term investors perk up, even if the headline numbers look volatile. Before you make any decisions, let us break down how valuation is measured and why the most common metrics sometimes miss what really matters, something we will get to before the end of this article.
Why Stellantis is lagging behind its peers
Approach 1: Stellantis Discounted Cash Flow (DCF) Analysis
The Discounted Cash Flow (DCF) model estimates a company's intrinsic value by projecting its future cash flows and then discounting them back to today's value. This approach is designed to account for both near-term performance and long-term growth potential, providing a robust estimate of what the business is really worth in the present moment.
For Stellantis, the current Free Cash Flow (FCF) over the last twelve months stands at a negative €10.91 billion, reflecting significant investments and operational changes. However, analysts forecast a turnaround and project FCF to grow to approximately €5.80 billion by 2029. Beyond the five-year analyst window, additional FCF projections are extrapolated, with Simply Wall St estimating steady increases that could reach nearly €7.47 billion by 2035. All figures are based on the 2 Stage Free Cash Flow to Equity model and are shown in euros (€).
Comparing these future cash flows to the company's share price today, the DCF model calculates an intrinsic value of €21.71 per share. This represents a 56.6% discount relative to the current share price, indicating Stellantis shares may be significantly undervalued based on these projections.
Result: UNDERVALUED
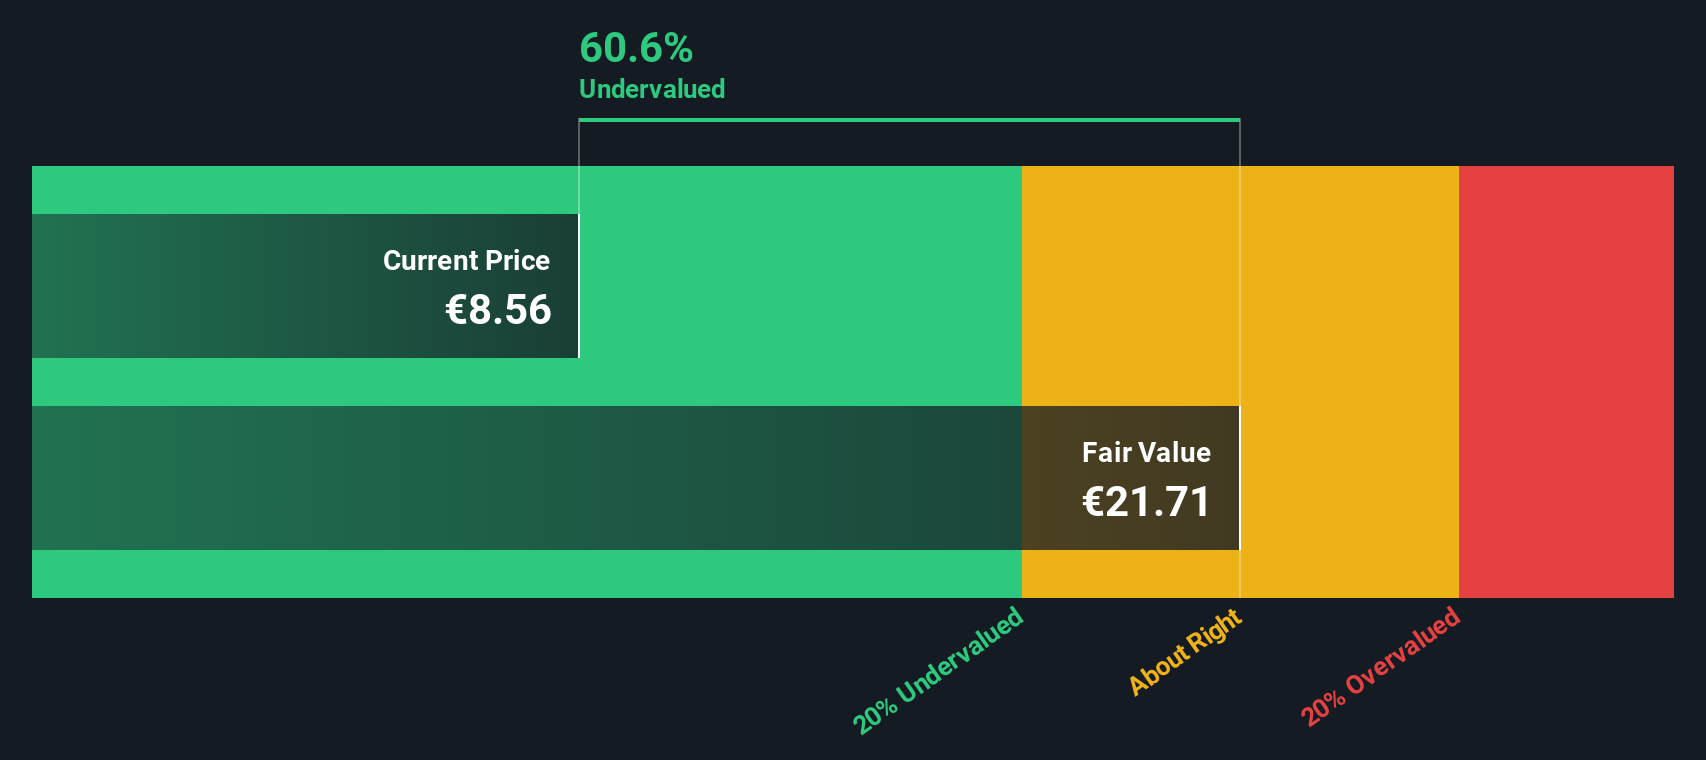
Our Discounted Cash Flow (DCF) analysis suggests Stellantis is undervalued by 56.6%. Track this in your watchlist or portfolio, or discover more undervalued stocks.
Approach 2: Stellantis Price vs Sales (P/S)
For profitable companies in industries with razor-thin margins, the Price-to-Sales (P/S) ratio is a solid way to measure value. This metric gives a cleaner picture of valuation compared to earnings-based multiples, especially when profits swing due to investments or non-cash items. Growth expectations and risks can nudge what investors consider a fair P/S multiple higher or lower. Fast-growing, lower-risk companies tend to command higher ratios, while slow-growing or more volatile ones typically trade at discounts.
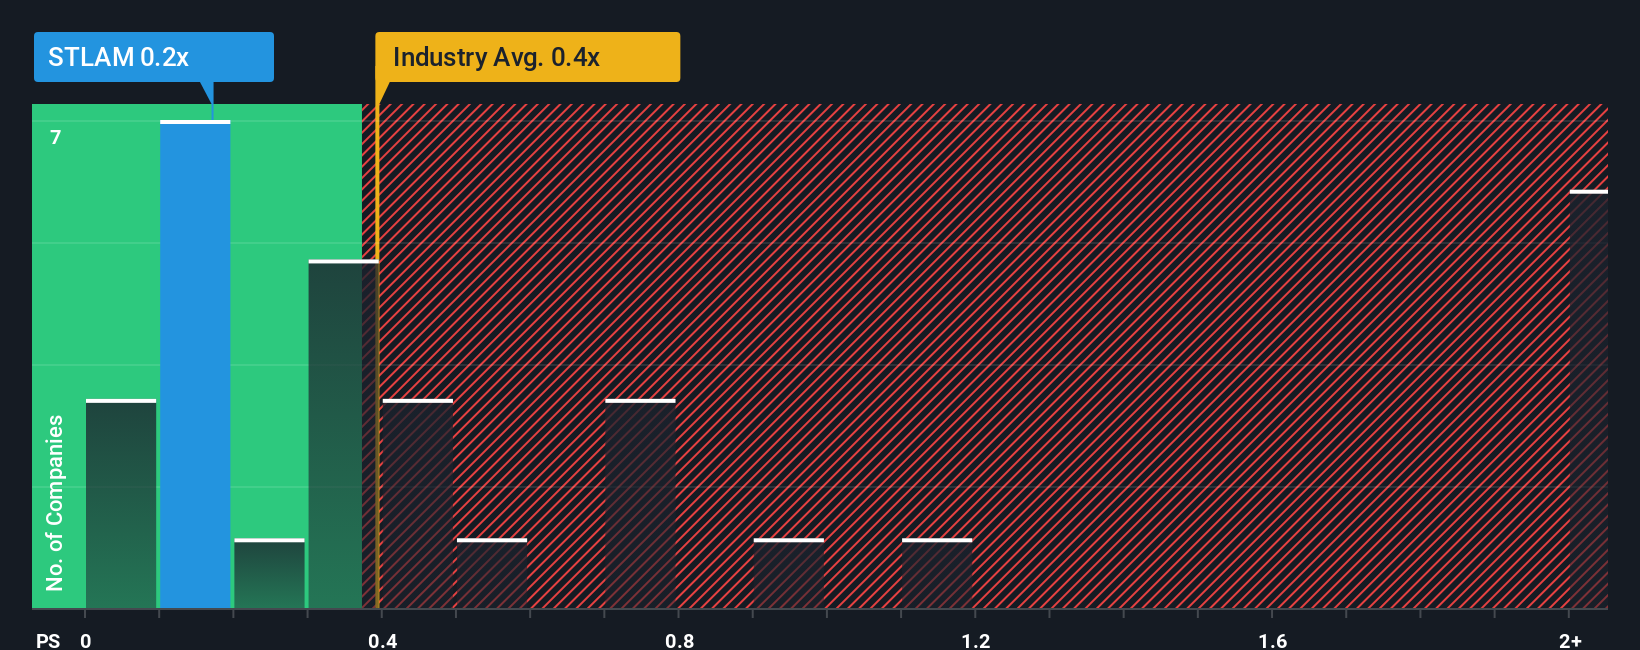
At the moment, Stellantis is trading at a P/S ratio of just 0.19x, which stands out against both its global Auto industry average of 0.88x and the peer group average of 3.18x. This gap suggests the market is pricing in more risk or less growth for Stellantis relative to its peers. However, looking just at these comparisons can be misleading, since company-specific factors often skew the story.
That is where the Simply Wall St "Fair Ratio" comes in. This proprietary metric considers Stellantis's earnings growth prospects, profit margins, market cap, industry dynamics, and risk profile to determine the multiple that would be justified in today's climate. The Fair Ratio for Stellantis sits at 0.43x, noticeably above both the current P/S and the industry average. Since the company’s P/S is well below this level, the stock appears attractively valued on a sales basis when accounting for its fundamentals.
Result: UNDERVALUED
PS ratios tell one story, but what if the real opportunity lies elsewhere? Discover companies where insiders are betting big on explosive growth.
Upgrade Your Decision Making: Choose your Stellantis Narrative
Earlier we mentioned that there is an even better way to understand valuation. Let's introduce you to Narratives. In investing, a Narrative is more than just a story; it is your perspective on a company, describing how you think its future will unfold. Then, you link this perspective to specific financial forecasts like future revenue, earnings, or profit margins, and ultimately, to what you believe is a fair value for the shares.
Narratives help bridge the gap between headline numbers and real-world business drivers. On the Simply Wall St platform, millions of investors use Narratives on the Community page, where you can craft your own view of Stellantis or see what others believe. Narratives let you connect the company’s outlook with your assumptions. When fair value is higher than the current price, you might see an opportunity. If it is lower, it could signal caution.
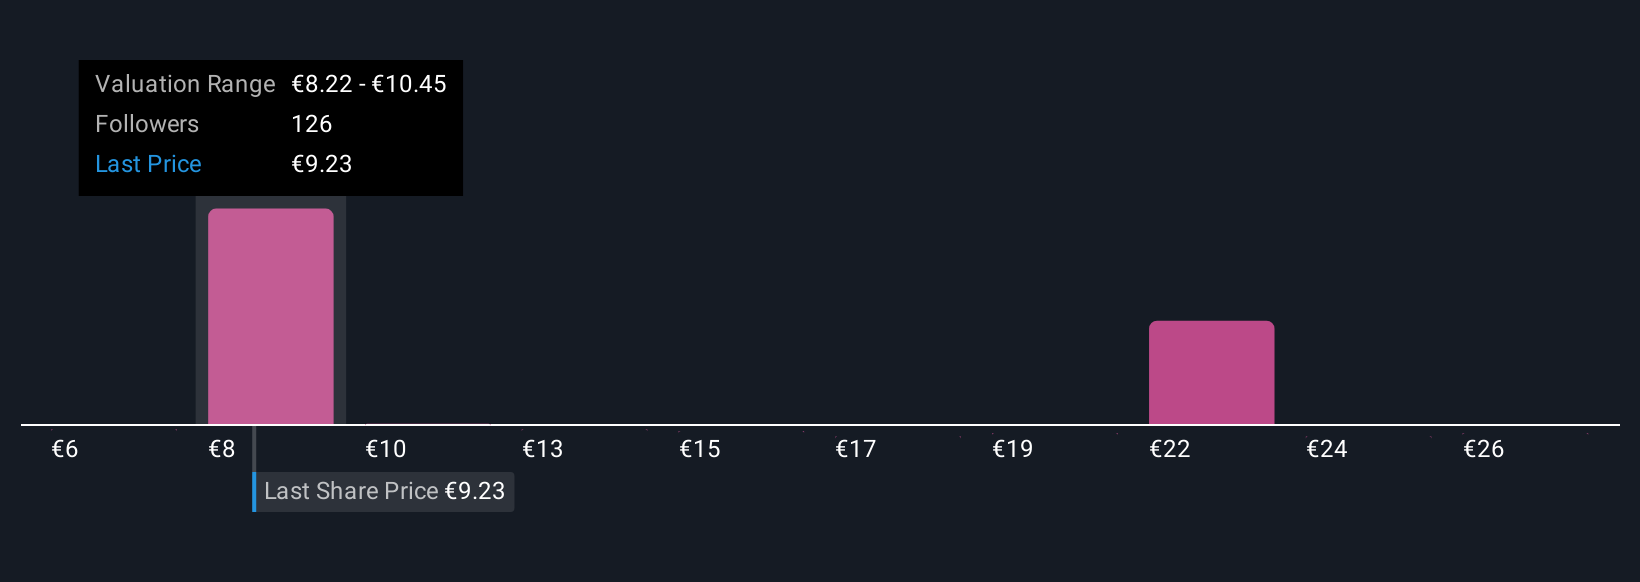
What makes Narratives especially powerful is that they update automatically when new news or earnings arrive. Your perspective stays in sync with reality. For example, one investor following Stellantis may emphasize electrification and market expansion. This could lead to a higher fair value and a target price as high as €14.0. Another investor may focus on industry headwinds or regulatory risks, resulting in a far lower estimate near €6.0.
Do you think there's more to the story for Stellantis? Create your own Narrative to let the Community know!
This article by Simply Wall St is general in nature. We provide commentary based on historical data and analyst forecasts only using an unbiased methodology and our articles are not intended to be financial advice. It does not constitute a recommendation to buy or sell any stock, and does not take account of your objectives, or your financial situation. We aim to bring you long-term focused analysis driven by fundamental data. Note that our analysis may not factor in the latest price-sensitive company announcements or qualitative material. Simply Wall St has no position in any stocks mentioned.
New: Manage All Your Stock Portfolios in One Place
We've created the ultimate portfolio companion for stock investors, and it's free.
• Connect an unlimited number of Portfolios and see your total in one currency
• Be alerted to new Warning Signs or Risks via email or mobile
• Track the Fair Value of your stocks
Have feedback on this article? Concerned about the content? Get in touch with us directly. Alternatively, email editorial-team@simplywallst.com
About BIT:STLAM
Stellantis
Engages in the design, engineering, manufacturing, distribution, and sale of automobiles and light commercial vehicles, engines, transmission systems, metallurgical products, mobility services, and production systems worldwide.
Undervalued with reasonable growth potential.
Similar Companies
Market Insights

Advertisement
Community Narratives
A formidable player in AI and enterprise computing.
Fair Value US$210.00|12.2% overvalued
CO
Community Contributor
IREN's Bold Moves in Sustainable Bitcoin Mining & AI Data Centers
Fair Value US$72.52|17.1% undervalued
BL
Community Contributor
Cooling the Champions: The Aussie Tech Behind F1's Victories
Fair Value AU$12.40|38.7% undervalued
TR
Community Contributor