
Advertisement
- India
- /
- Renewable Energy
- /
- NSEI:PTC
PTC India Limited's (NSE:PTC) Financials Are Too Obscure To Link With Current Share Price Momentum: What's In Store For the Stock?
PTC India's (NSE:PTC) stock is up by a considerable 29% over the past three months. However, we decided to pay attention to the company's fundamentals which don't appear to give a clear sign about the company's financial health. In this article, we decided to focus on PTC India's ROE.
ROE or return on equity is a useful tool to assess how effectively a company can generate returns on the investment it received from its shareholders. Put another way, it reveals the company's success at turning shareholder investments into profits.
How Is ROE Calculated?
The formula for return on equity is:
Return on Equity = Net Profit (from continuing operations) ÷ Shareholders' Equity
So, based on the above formula, the ROE for PTC India is:
9.4% = ₹5.9b ÷ ₹62b (Based on the trailing twelve months to December 2024).
The 'return' refers to a company's earnings over the last year. Another way to think of that is that for every ₹1 worth of equity, the company was able to earn ₹0.09 in profit.
View our latest analysis for PTC India
What Has ROE Got To Do With Earnings Growth?
We have already established that ROE serves as an efficient profit-generating gauge for a company's future earnings. Based on how much of its profits the company chooses to reinvest or "retain", we are then able to evaluate a company's future ability to generate profits. Assuming all else is equal, companies that have both a higher return on equity and higher profit retention are usually the ones that have a higher growth rate when compared to companies that don't have the same features.
PTC India's Earnings Growth And 9.4% ROE
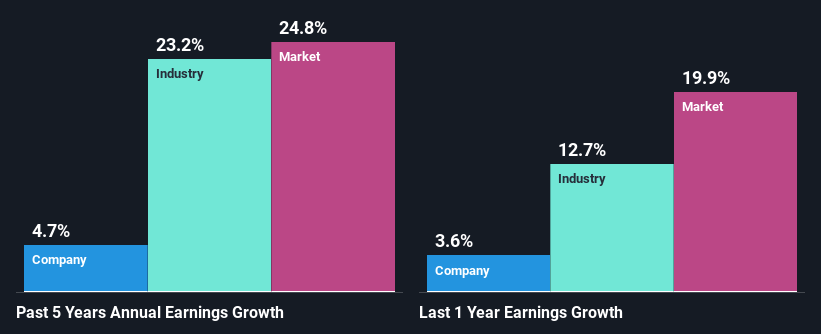
When you first look at it, PTC India's ROE doesn't look that attractive. However, given that the company's ROE is similar to the average industry ROE of 9.4%, we may spare it some thought. On the other hand, PTC India reported a fairly low 4.7% net income growth over the past five years. Remember, the company's ROE is not particularly great to begin with. Hence, this does provide some context to low earnings growth seen by the company.
We then compared PTC India's net income growth with the industry and found that the company's growth figure is lower than the average industry growth rate of 23% in the same 5-year period, which is a bit concerning.
The basis for attaching value to a company is, to a great extent, tied to its earnings growth. The investor should try to establish if the expected growth or decline in earnings, whichever the case may be, is priced in. By doing so, they will have an idea if the stock is headed into clear blue waters or if swampy waters await. Is PTC India fairly valued compared to other companies? These 3 valuation measures might help you decide.
Is PTC India Making Efficient Use Of Its Profits?
While PTC India has a decent three-year median payout ratio of 46% (or a retention ratio of 54%), it has seen very little growth in earnings. So there might be other factors at play here which could potentially be hampering growth. For example, the business has faced some headwinds.
Additionally, PTC India has paid dividends over a period of at least ten years, which means that the company's management is determined to pay dividends even if it means little to no earnings growth.
Conclusion
In total, we're a bit ambivalent about PTC India's performance. While the company does have a high rate of reinvestment, the low ROE means that all that reinvestment is not reaping any benefit to its investors, and moreover, its having a negative impact on the earnings growth. Wrapping up, we would proceed with caution with this company and one way of doing that would be to look at the risk profile of the business. You can see the 1 risk we have identified for PTC India by visiting our risks dashboard for free on our platform here.
New: Manage All Your Stock Portfolios in One Place
We've created the ultimate portfolio companion for stock investors, and it's free.
• Connect an unlimited number of Portfolios and see your total in one currency
• Be alerted to new Warning Signs or Risks via email or mobile
• Track the Fair Value of your stocks
Have feedback on this article? Concerned about the content? Get in touch with us directly. Alternatively, email editorial-team (at) simplywallst.com.
This article by Simply Wall St is general in nature. We provide commentary based on historical data and analyst forecasts only using an unbiased methodology and our articles are not intended to be financial advice. It does not constitute a recommendation to buy or sell any stock, and does not take account of your objectives, or your financial situation. We aim to bring you long-term focused analysis driven by fundamental data. Note that our analysis may not factor in the latest price-sensitive company announcements or qualitative material. Simply Wall St has no position in any stocks mentioned.
About NSEI:PTC
PTC India
Engages in the trading and generating of power in India, Nepal, Bhutan, and Bangladesh.
Flawless balance sheet established dividend payer.
Market Insights

Advertisement
Community Narratives
A formidable player in AI and enterprise computing.
Fair Value US$210.00|13.6% overvalued
CO
Community Contributor
IREN's Bold Moves in Sustainable Bitcoin Mining & AI Data Centers
Fair Value US$89.00|23.6% undervalued
BL
Community Contributor
Cooling the Champions: The Aussie Tech Behind F1's Victories
Fair Value AU$12.40|40.6% undervalued
TR
Community Contributor