Advertisement
- India
- /
- Renewable Energy
- /
- NSEI:PTC
3 Leading Dividend Stocks In India With Up To 7.7% Yield

Simply Wall St
Reviewed by Simply Wall St
In the last week, the Indian market has been flat, but it is up 43% over the past year with earnings forecast to grow by 17% annually. In this thriving environment, dividend stocks that offer substantial yields and stable returns become particularly attractive to investors.
Top 10 Dividend Stocks In India
| Name | Dividend Yield | Dividend Rating |
| Balmer Lawrie Investments (BSE:532485) | 3.91% | ★★★★★★ |
| D. B (NSEI:DBCORP) | 5.10% | ★★★★★☆ |
| Indian Oil (NSEI:IOC) | 7.72% | ★★★★★☆ |
| Bharat Petroleum (NSEI:BPCL) | 5.82% | ★★★★★☆ |
| NMDC (BSE:526371) | 3.41% | ★★★★★☆ |
| Hindustan Zinc (BSE:500188) | 3.23% | ★★★★★☆ |
| Balmer Lawrie (BSE:523319) | 3.06% | ★★★★★☆ |
| Redington (NSEI:REDINGTON) | 3.12% | ★★★★★☆ |
| Bank of Baroda (NSEI:BANKBARODA) | 3.12% | ★★★★★☆ |
| PTC India (NSEI:PTC) | 3.56% | ★★★★★☆ |
Click here to see the full list of 15 stocks from our Top Indian Dividend Stocks screener.
Let's review some notable picks from our screened stocks.
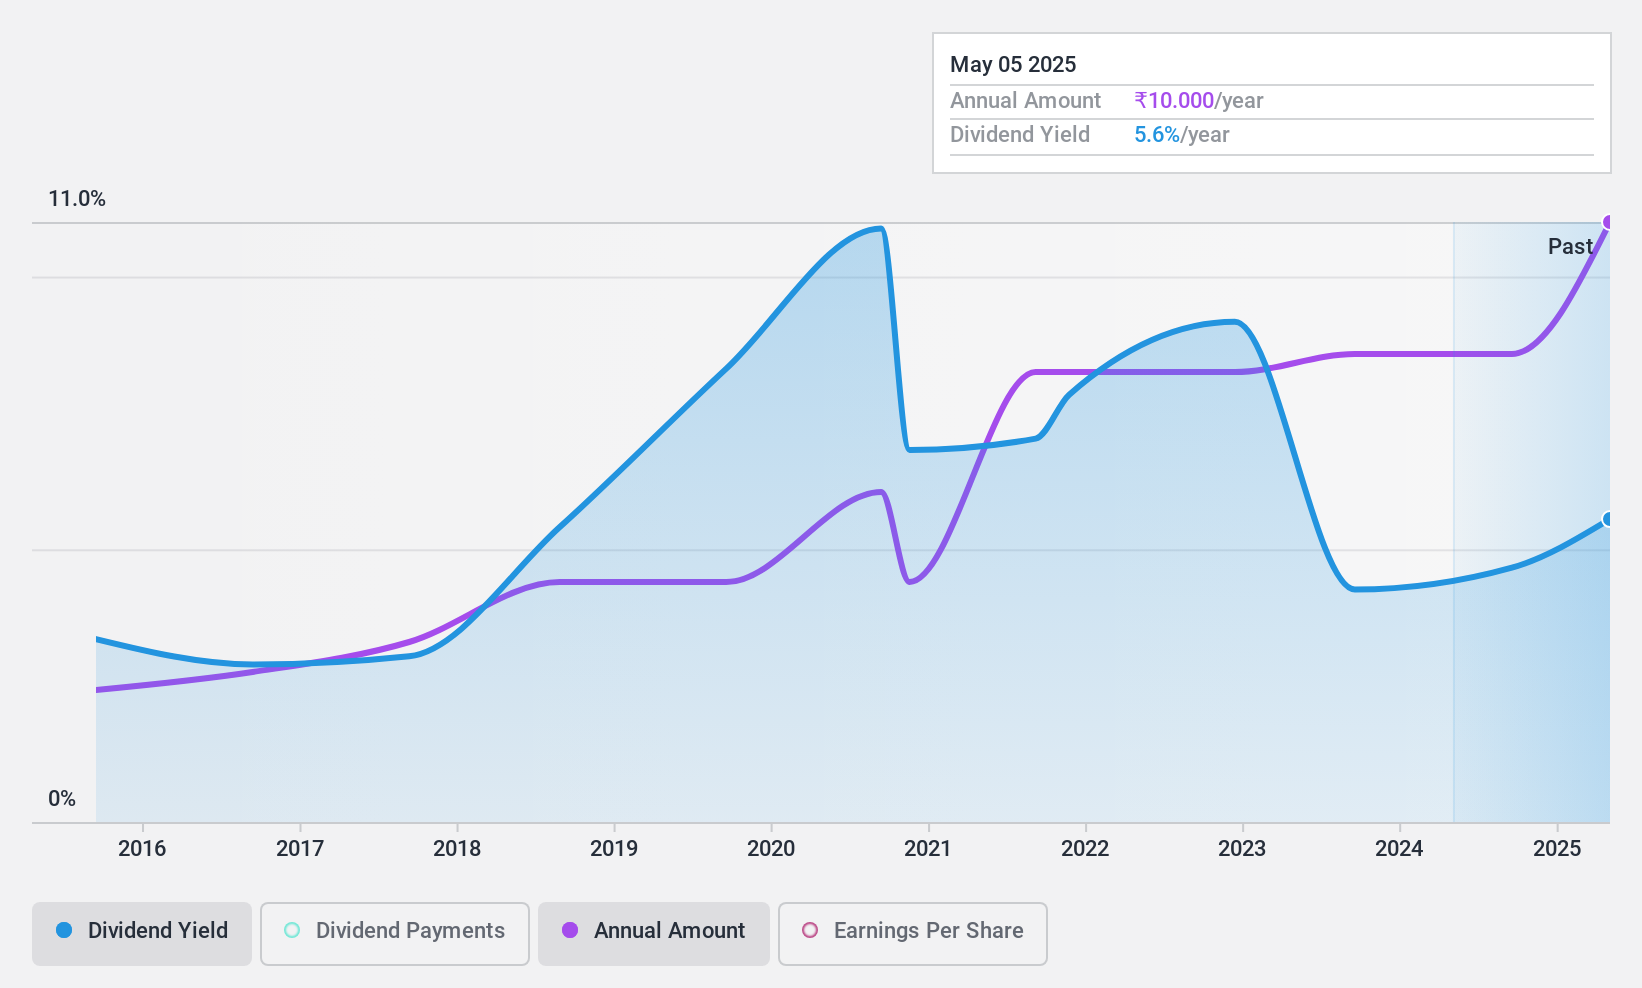
D. B (NSEI:DBCORP)
Simply Wall St Dividend Rating: ★★★★★☆
Overview: D. B. Corp Limited operates in newspaper printing and publishing, radio broadcasting, and digital news platforms for news and event management in India and internationally, with a market cap of ₹59.43 billion.
Operations: D. B. Corp Limited generates revenue primarily from its printing, publishing, and allied business segment (₹22.77 billion) and radio broadcasting segment (₹1.62 billion).
Dividend Yield: 5.1%
D. B. Corp Limited offers a dividend yield of 5.1%, placing it in the top 25% of Indian market payers, with dividends covered by earnings (65.2%) and cash flows (57%). However, its dividend history has been volatile over the past decade despite recent increases. The company reported strong Q1 2024 results with net income rising to ₹1.18 billion from ₹787.59 million YoY, reflecting robust financial health but an unstable dividend track record remains a concern for investors seeking consistent returns.
- Take a closer look at D. B's potential here in our dividend report.
- Our valuation report here indicates D. B may be undervalued.

Indian Oil (NSEI:IOC)
Simply Wall St Dividend Rating: ★★★★★☆
Overview: Indian Oil Corporation Limited, along with its subsidiaries, engages in refining, pipeline transportation, and marketing of petroleum products both in India and internationally, with a market cap of ₹2.50 trillion.
Operations: Indian Oil Corporation Limited generates revenue from petrochemicals (₹262.95 billion) and petroleum products (₹8.25 trillion).
Dividend Yield: 7.7%
Indian Oil Corporation Limited offers a dividend yield of 7.72%, ranking it in the top 25% of Indian market payers, with dividends well-covered by earnings (39.6%) and cash flows (56.8%). Despite recent increases, its dividend history has been volatile over the past decade. Recent changes in senior management and a final dividend declaration of ₹7 per share for FY2023-24 highlight ongoing corporate adjustments amid fluctuating financial performance, including a significant drop in Q1 net income YoY.
- Click here and access our complete dividend analysis report to understand the dynamics of Indian Oil.
- The valuation report we've compiled suggests that Indian Oil's current price could be quite moderate.
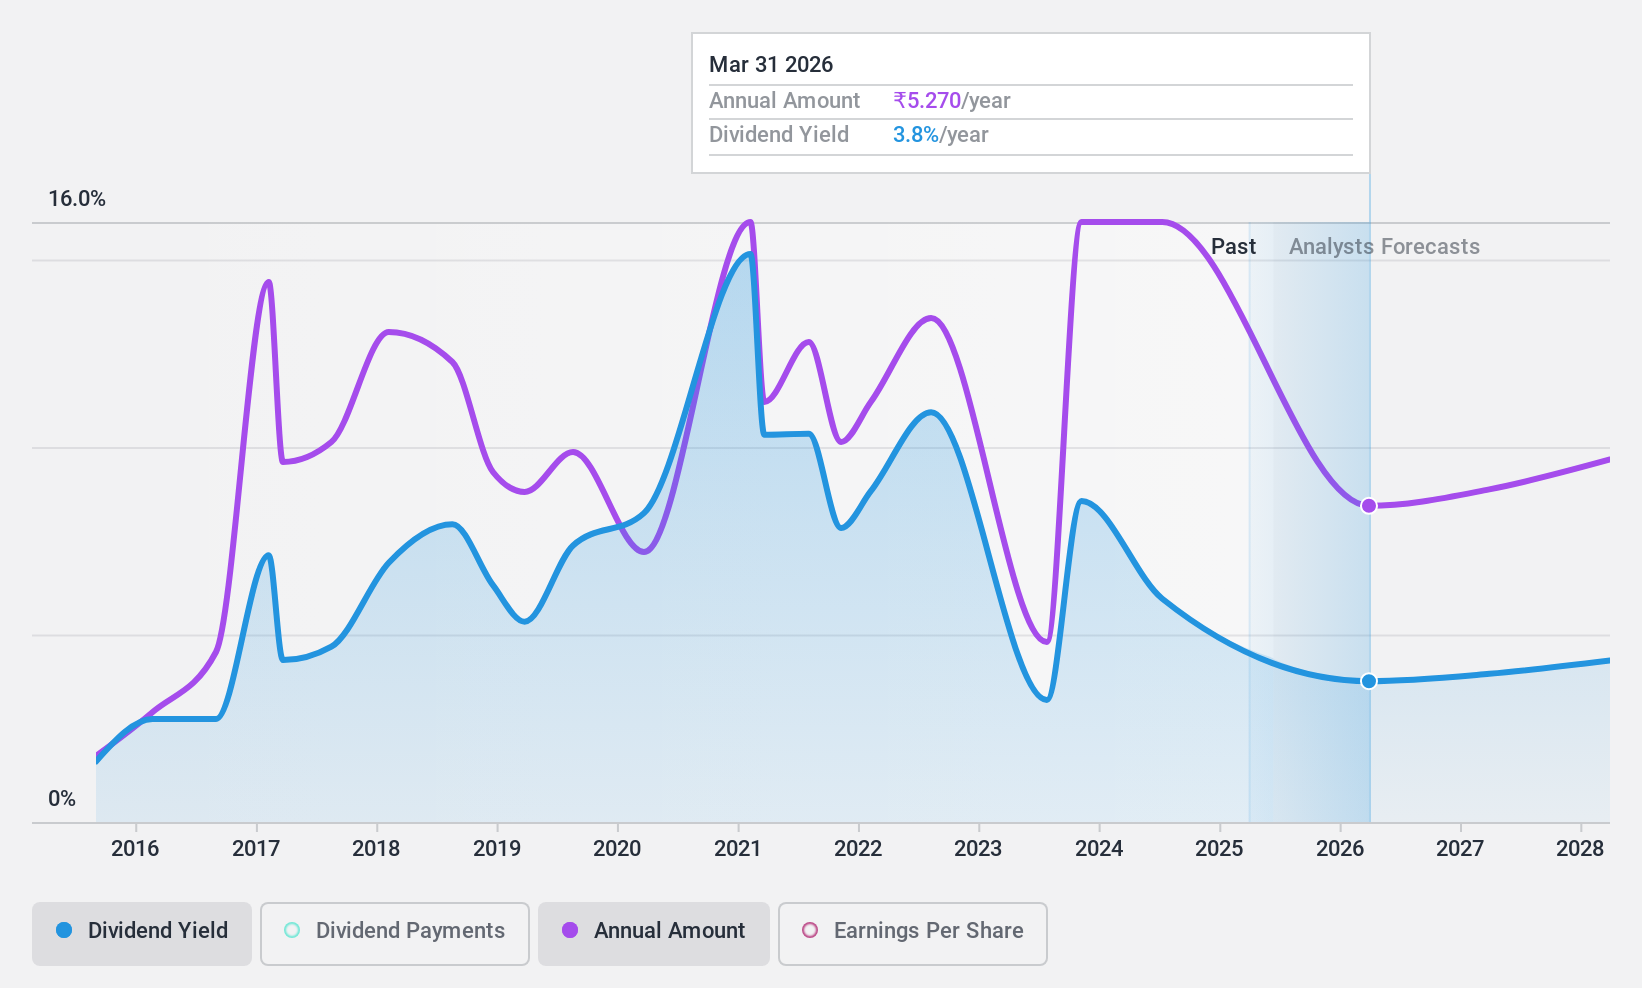
PTC India (NSEI:PTC)
Simply Wall St Dividend Rating: ★★★★★☆
Overview: PTC India Limited, with a market cap of ₹64.82 billion, engages in the trading of power across India, Nepal, Bhutan, and Bangladesh through its subsidiaries.
Operations: PTC India Limited generates revenue primarily from power trading, amounting to ₹159.67 billion, and its financing business, which contributes ₹7.35 billion.
Dividend Yield: 3.6%
PTC India's dividend yield of 3.56% places it in the top 25% of Indian market payers, supported by a reasonable payout ratio (54%) and strong cash flow coverage (9.4%). However, its dividend history has been unstable over the past decade despite recent increases. The company's Q1 FY2025 earnings showed improved net income (₹1.74 billion) compared to the previous year, amidst ongoing executive changes and regulatory challenges affecting senior management roles.
- Click to explore a detailed breakdown of our findings in PTC India's dividend report.
- Our comprehensive valuation report raises the possibility that PTC India is priced higher than what may be justified by its financials.
Taking Advantage
- Click this link to deep-dive into the 15 companies within our Top Indian Dividend Stocks screener.
- Are any of these part of your asset mix? Tap into the analytical power of Simply Wall St's portfolio to get a 360-degree view on how they're shaping up.
- Discover a world of investment opportunities with Simply Wall St's free app and access unparalleled stock analysis across all markets.
Seeking Other Investments?
- Explore high-performing small cap companies that haven't yet garnered significant analyst attention.
- Fuel your portfolio with companies showing strong growth potential, backed by optimistic outlooks both from analysts and management.
- Find companies with promising cash flow potential yet trading below their fair value.
This article by Simply Wall St is general in nature. We provide commentary based on historical data and analyst forecasts only using an unbiased methodology and our articles are not intended to be financial advice. It does not constitute a recommendation to buy or sell any stock, and does not take account of your objectives, or your financial situation. We aim to bring you long-term focused analysis driven by fundamental data. Note that our analysis may not factor in the latest price-sensitive company announcements or qualitative material. Simply Wall St has no position in any stocks mentioned.
New: Manage All Your Stock Portfolios in One Place
We've created the ultimate portfolio companion for stock investors, and it's free.
• Connect an unlimited number of Portfolios and see your total in one currency
• Be alerted to new Warning Signs or Risks via email or mobile
• Track the Fair Value of your stocks
Have feedback on this article? Concerned about the content? Get in touch with us directly. Alternatively, email editorial-team@simplywallst.com
About NSEI:PTC
PTC India
Engages in the trading and generating of power in India, Nepal, Bhutan, and Bangladesh.
Flawless balance sheet established dividend payer.
Market Insights

Advertisement
Community Narratives
The company that turned a verb into a global necessity and basically runs the modern internet, digital ads, smartphones, maps, and AI.
Fair Value US$300.00|10.8% undervalued
OS
Community Contributor
Flowers Foods Pays A Fair Price For Health
Fair Value US$16.12|22.0% undervalued
NV
Community Contributor
TMX Group will thrive with 33.3% profit margin and enduring market moat
Fair Value CA$49.90|3.8% overvalued
LI
Community Contributor