
Advertisement
- India
- /
- Renewable Energy
- /
- NSEI:NLCINDIA
NLC India Limited's (NSE:NLCINDIA) market cap touched ₹398b last week, benefiting both state or government who own 74% as well as institutions

Key Insights
- The considerable ownership by state or government in NLC India indicates that they collectively have a greater say in management and business strategy
- 72% of the company is held by a single shareholder (India)
- Institutions own 14% of NLC India
A look at the shareholders of NLC India Limited (NSE:NLCINDIA) can tell us which group is most powerful. And the group that holds the biggest piece of the pie are state or government with 74% ownership. In other words, the group stands to gain the most (or lose the most) from their investment into the company.
While state or government were the group that reaped the most benefits after last week’s 9.6% price gain, institutions also received a 14% cut.
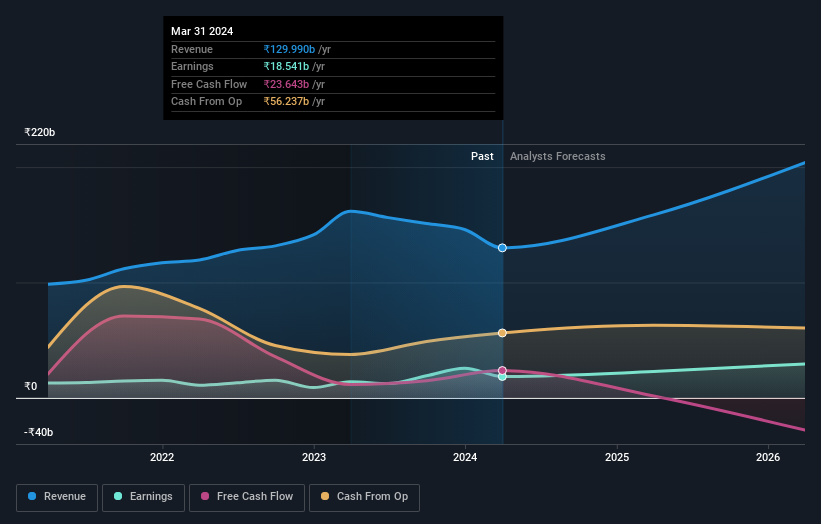
In the chart below, we zoom in on the different ownership groups of NLC India.
See our latest analysis for NLC India

What Does The Institutional Ownership Tell Us About NLC India?
Many institutions measure their performance against an index that approximates the local market. So they usually pay more attention to companies that are included in major indices.
We can see that NLC India does have institutional investors; and they hold a good portion of the company's stock. This suggests some credibility amongst professional investors. But we can't rely on that fact alone since institutions make bad investments sometimes, just like everyone does. If multiple institutions change their view on a stock at the same time, you could see the share price drop fast. It's therefore worth looking at NLC India's earnings history below. Of course, the future is what really matters.
We note that hedge funds don't have a meaningful investment in NLC India. India is currently the largest shareholder, with 72% of shares outstanding. This implies that they have majority interest control of the future of the company. In comparison, the second and third largest shareholders hold about 5.1% and 2.2% of the stock.
While it makes sense to study institutional ownership data for a company, it also makes sense to study analyst sentiments to know which way the wind is blowing. There is some analyst coverage of the stock, but it could still become more well known, with time.
Insider Ownership Of NLC India
The definition of an insider can differ slightly between different countries, but members of the board of directors always count. Management ultimately answers to the board. However, it is not uncommon for managers to be executive board members, especially if they are a founder or the CEO.
I generally consider insider ownership to be a good thing. However, on some occasions it makes it more difficult for other shareholders to hold the board accountable for decisions.
Our most recent data indicates that insiders own less than 1% of NLC India Limited. Keep in mind that it's a big company, and the insiders own ₹1.1m worth of shares. The absolute value might be more important than the proportional share. Arguably, recent buying and selling is just as important to consider. You can click here to see if insiders have been buying or selling.
General Public Ownership
The general public, who are usually individual investors, hold a 12% stake in NLC India. While this size of ownership may not be enough to sway a policy decision in their favour, they can still make a collective impact on company policies.
Next Steps:
I find it very interesting to look at who exactly owns a company. But to truly gain insight, we need to consider other information, too. Consider for instance, the ever-present spectre of investment risk. We've identified 2 warning signs with NLC India , and understanding them should be part of your investment process.
If you would prefer discover what analysts are predicting in terms of future growth, do not miss this free report on analyst forecasts.
NB: Figures in this article are calculated using data from the last twelve months, which refer to the 12-month period ending on the last date of the month the financial statement is dated. This may not be consistent with full year annual report figures.
Valuation is complex, but we're here to simplify it.
Discover if NLC India might be undervalued or overvalued with our detailed analysis, featuring fair value estimates, potential risks, dividends, insider trades, and its financial condition.
Access Free AnalysisHave feedback on this article? Concerned about the content? Get in touch with us directly. Alternatively, email editorial-team (at) simplywallst.com.
This article by Simply Wall St is general in nature. We provide commentary based on historical data and analyst forecasts only using an unbiased methodology and our articles are not intended to be financial advice. It does not constitute a recommendation to buy or sell any stock, and does not take account of your objectives, or your financial situation. We aim to bring you long-term focused analysis driven by fundamental data. Note that our analysis may not factor in the latest price-sensitive company announcements or qualitative material. Simply Wall St has no position in any stocks mentioned.
Have feedback on this article? Concerned about the content? Get in touch with us directly. Alternatively, email editorial-team@simplywallst.com
About NSEI:NLCINDIA
Solid track record average dividend payer.
Market Insights

Advertisement
Community Narratives
Pinterest will surge as advertising innovations ignite revenue growth
Fair Value US$42.63|26.1% undervalued
BR
Community Contributor
Brambles' Revenue Set to Climb 14% with Profit Margins Following
Fair Value AU$21.90|4.8% overvalued
RO
Community Contributor
Challenging Future for STG as Organic Sales Decline by 8.8%
Fair Value DKK 116.13|26.8% undervalued
KA
Community Contributor