
Advertisement
Investors Should Be Encouraged By Blue Dart Express' (NSE:BLUEDART) Returns On Capital
What trends should we look for it we want to identify stocks that can multiply in value over the long term? Typically, we'll want to notice a trend of growing return on capital employed (ROCE) and alongside that, an expanding base of capital employed. Basically this means that a company has profitable initiatives that it can continue to reinvest in, which is a trait of a compounding machine. So when we looked at the ROCE trend of Blue Dart Express (NSE:BLUEDART) we really liked what we saw.
Return On Capital Employed (ROCE): What Is It?
For those that aren't sure what ROCE is, it measures the amount of pre-tax profits a company can generate from the capital employed in its business. The formula for this calculation on Blue Dart Express is:
Return on Capital Employed = Earnings Before Interest and Tax (EBIT) ÷ (Total Assets - Current Liabilities)
0.21 = ₹4.2b ÷ (₹35b - ₹15b) (Based on the trailing twelve months to June 2024).
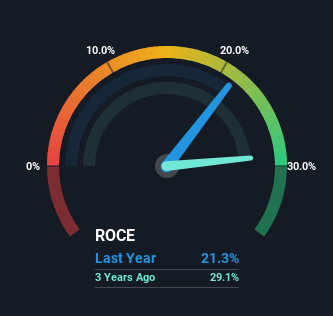
Therefore, Blue Dart Express has an ROCE of 21%. That's a fantastic return and not only that, it outpaces the average of 12% earned by companies in a similar industry.
View our latest analysis for Blue Dart Express
Above you can see how the current ROCE for Blue Dart Express compares to its prior returns on capital, but there's only so much you can tell from the past. If you're interested, you can view the analysts predictions in our free analyst report for Blue Dart Express .
What The Trend Of ROCE Can Tell Us
We like the trends that we're seeing from Blue Dart Express. The numbers show that in the last five years, the returns generated on capital employed have grown considerably to 21%. The amount of capital employed has increased too, by 92%. So we're very much inspired by what we're seeing at Blue Dart Express thanks to its ability to profitably reinvest capital.
On a separate but related note, it's important to know that Blue Dart Express has a current liabilities to total assets ratio of 43%, which we'd consider pretty high. This effectively means that suppliers (or short-term creditors) are funding a large portion of the business, so just be aware that this can introduce some elements of risk. Ideally we'd like to see this reduce as that would mean fewer obligations bearing risks.
In Conclusion...
All in all, it's terrific to see that Blue Dart Express is reaping the rewards from prior investments and is growing its capital base. Since the stock has returned a staggering 296% to shareholders over the last five years, it looks like investors are recognizing these changes. In light of that, we think it's worth looking further into this stock because if Blue Dart Express can keep these trends up, it could have a bright future ahead.
If you want to continue researching Blue Dart Express, you might be interested to know about the 2 warning signs that our analysis has discovered.
Blue Dart Express is not the only stock earning high returns. If you'd like to see more, check out our free list of companies earning high returns on equity with solid fundamentals.
Valuation is complex, but we're here to simplify it.
Discover if Blue Dart Express might be undervalued or overvalued with our detailed analysis, featuring fair value estimates, potential risks, dividends, insider trades, and its financial condition.
Access Free AnalysisHave feedback on this article? Concerned about the content? Get in touch with us directly. Alternatively, email editorial-team (at) simplywallst.com.
This article by Simply Wall St is general in nature. We provide commentary based on historical data and analyst forecasts only using an unbiased methodology and our articles are not intended to be financial advice. It does not constitute a recommendation to buy or sell any stock, and does not take account of your objectives, or your financial situation. We aim to bring you long-term focused analysis driven by fundamental data. Note that our analysis may not factor in the latest price-sensitive company announcements or qualitative material. Simply Wall St has no position in any stocks mentioned.
About NSEI:BLUEDART
Flawless balance sheet with reasonable growth potential and pays a dividend.
Similar Companies
Market Insights


Advertisement
Community Narratives
America Wants Homegrown Drones — Draganfly Is Ready to Deliver
Fair Value US$9.21|27.4% undervalued
JO
Community Contributor
Cheesecake Factory offers an enticing opportunity for long-term growth by leveraging new concepts
Fair Value US$73.83|25.8% undervalued
ZW
Community Contributor
Coca-Cola’s Intrinsic Value Set to Rise with Fed Rate Cut
Fair Value US$67.50|2.7% undervalued
AL
Community Contributor
Fully Permitted Gold Mine with 50 Baggers Potential 
Fair Value CA$41.00|98.0% undervalued
RO
Community Contributor