
Advertisement
- India
- /
- Infrastructure
- /
- NSEI:ADANIPORTS
We Think Adani Ports and Special Economic Zone (NSE:ADANIPORTS) Can Stay On Top Of Its Debt
Howard Marks put it nicely when he said that, rather than worrying about share price volatility, 'The possibility of permanent loss is the risk I worry about... and every practical investor I know worries about.' It's only natural to consider a company's balance sheet when you examine how risky it is, since debt is often involved when a business collapses. As with many other companies Adani Ports and Special Economic Zone Limited (NSE:ADANIPORTS) makes use of debt. But the more important question is: how much risk is that debt creating?
What Risk Does Debt Bring?
Generally speaking, debt only becomes a real problem when a company can't easily pay it off, either by raising capital or with its own cash flow. Part and parcel of capitalism is the process of 'creative destruction' where failed businesses are mercilessly liquidated by their bankers. While that is not too common, we often do see indebted companies permanently diluting shareholders because lenders force them to raise capital at a distressed price. Having said that, the most common situation is where a company manages its debt reasonably well - and to its own advantage. When we think about a company's use of debt, we first look at cash and debt together.
Check out our latest analysis for Adani Ports and Special Economic Zone
How Much Debt Does Adani Ports and Special Economic Zone Carry?
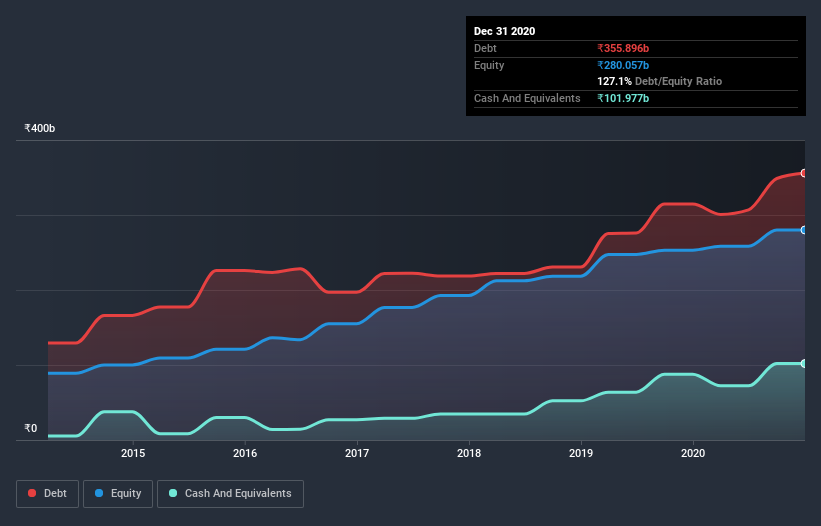
You can click the graphic below for the historical numbers, but it shows that as of September 2020 Adani Ports and Special Economic Zone had ₹348.3b of debt, an increase on ₹314.6b, over one year. However, it also had ₹102.0b in cash, and so its net debt is ₹246.3b.
How Strong Is Adani Ports and Special Economic Zone's Balance Sheet?
The latest balance sheet data shows that Adani Ports and Special Economic Zone had liabilities of ₹70.5b due within a year, and liabilities of ₹364.1b falling due after that. Offsetting these obligations, it had cash of ₹102.0b as well as receivables valued at ₹106.5b due within 12 months. So its liabilities total ₹226.1b more than the combination of its cash and short-term receivables.
Given Adani Ports and Special Economic Zone has a humongous market capitalization of ₹1.33t, it's hard to believe these liabilities pose much threat. Having said that, it's clear that we should continue to monitor its balance sheet, lest it change for the worse.
In order to size up a company's debt relative to its earnings, we calculate its net debt divided by its earnings before interest, tax, depreciation, and amortization (EBITDA) and its earnings before interest and tax (EBIT) divided by its interest expense (its interest cover). The advantage of this approach is that we take into account both the absolute quantum of debt (with net debt to EBITDA) and the actual interest expenses associated with that debt (with its interest cover ratio).
Adani Ports and Special Economic Zone's net debt is 3.4 times its EBITDA, which is a significant but still reasonable amount of leverage. But its EBIT was about 23.9 times its interest expense, implying the company isn't really paying a high cost to maintain that level of debt. Even were the low cost to prove unsustainable, that is a good sign. Unfortunately, Adani Ports and Special Economic Zone saw its EBIT slide 6.5% in the last twelve months. If earnings continue on that decline then managing that debt will be difficult like delivering hot soup on a unicycle. The balance sheet is clearly the area to focus on when you are analysing debt. But ultimately the future profitability of the business will decide if Adani Ports and Special Economic Zone can strengthen its balance sheet over time. So if you want to see what the professionals think, you might find this free report on analyst profit forecasts to be interesting.
But our final consideration is also important, because a company cannot pay debt with paper profits; it needs cold hard cash. So the logical step is to look at the proportion of that EBIT that is matched by actual free cash flow. Over the most recent three years, Adani Ports and Special Economic Zone recorded free cash flow worth 61% of its EBIT, which is around normal, given free cash flow excludes interest and tax. This cold hard cash means it can reduce its debt when it wants to.
Our View
On our analysis Adani Ports and Special Economic Zone's interest cover should signal that it won't have too much trouble with its debt. However, our other observations weren't so heartening. For instance it seems like it has to struggle a bit handle its debt, based on its EBITDA,. We would also note that Infrastructure industry companies like Adani Ports and Special Economic Zone commonly do use debt without problems. When we consider all the elements mentioned above, it seems to us that Adani Ports and Special Economic Zone is managing its debt quite well. But a word of caution: we think debt levels are high enough to justify ongoing monitoring. There's no doubt that we learn most about debt from the balance sheet. However, not all investment risk resides within the balance sheet - far from it. Be aware that Adani Ports and Special Economic Zone is showing 3 warning signs in our investment analysis , you should know about...
Of course, if you're the type of investor who prefers buying stocks without the burden of debt, then don't hesitate to discover our exclusive list of net cash growth stocks, today.
When trading Adani Ports and Special Economic Zone or any other investment, use the platform considered by many to be the Professional's Gateway to the Worlds Market, Interactive Brokers. You get the lowest-cost* trading on stocks, options, futures, forex, bonds and funds worldwide from a single integrated account. Promoted
New: Manage All Your Stock Portfolios in One Place
We've created the ultimate portfolio companion for stock investors, and it's free.
• Connect an unlimited number of Portfolios and see your total in one currency
• Be alerted to new Warning Signs or Risks via email or mobile
• Track the Fair Value of your stocks
This article by Simply Wall St is general in nature. It does not constitute a recommendation to buy or sell any stock, and does not take account of your objectives, or your financial situation. We aim to bring you long-term focused analysis driven by fundamental data. Note that our analysis may not factor in the latest price-sensitive company announcements or qualitative material. Simply Wall St has no position in any stocks mentioned.
*Interactive Brokers Rated Lowest Cost Broker by StockBrokers.com Annual Online Review 2020
Have feedback on this article? Concerned about the content? Get in touch with us directly. Alternatively, email editorial-team (at) simplywallst.com.
About NSEI:ADANIPORTS
Adani Ports and Special Economic Zone
Operates and maintains port infrastructure facilities in India.
Solid track record average dividend payer.
Similar Companies
Market Insights

Advertisement
Community Narratives
Scaling up in building materials with smart M&A and growing profitability
Fair Value US$2.77|28.9% undervalued
CM
Community Contributor
Hims: The Platform Powering Personalised Healthcare
Fair Value US$114.01|46.3% undervalued
BL
Community Contributor
Undervalued lottery company with strong fundamentals
Fair Value AU$15.00|35.8% undervalued
RO
Community Contributor
Proximus, transferring money from the impatient to the patient investor
Fair Value €16.62|56.1% undervalued
AX
Community Contributor