
Advertisement
Legendary fund manager Li Lu (who Charlie Munger backed) once said, 'The biggest investment risk is not the volatility of prices, but whether you will suffer a permanent loss of capital.' So it seems the smart money knows that debt - which is usually involved in bankruptcies - is a very important factor, when you assess how risky a company is. Importantly, Nelco Limited (NSE:NELCO) does carry debt. But should shareholders be worried about its use of debt?
When Is Debt Dangerous?
Debt is a tool to help businesses grow, but if a business is incapable of paying off its lenders, then it exists at their mercy. If things get really bad, the lenders can take control of the business. However, a more frequent (but still costly) occurrence is where a company must issue shares at bargain-basement prices, permanently diluting shareholders, just to shore up its balance sheet. Of course, debt can be an important tool in businesses, particularly capital heavy businesses. The first step when considering a company's debt levels is to consider its cash and debt together.
Check out our latest analysis for Nelco
What Is Nelco's Debt?
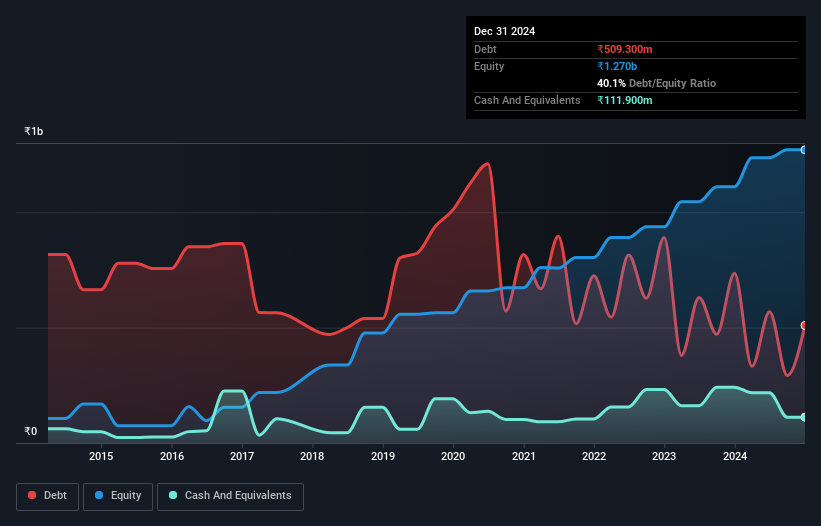
The image below, which you can click on for greater detail, shows that Nelco had debt of ₹509.3m at the end of September 2024, a reduction from ₹735.2m over a year. However, it also had ₹111.9m in cash, and so its net debt is ₹397.4m.
How Strong Is Nelco's Balance Sheet?
The latest balance sheet data shows that Nelco had liabilities of ₹1.38b due within a year, and liabilities of ₹172.5m falling due after that. Offsetting this, it had ₹111.9m in cash and ₹1.03b in receivables that were due within 12 months. So its liabilities total ₹415.7m more than the combination of its cash and short-term receivables.
Of course, Nelco has a market capitalization of ₹19.2b, so these liabilities are probably manageable. However, we do think it is worth keeping an eye on its balance sheet strength, as it may change over time.
In order to size up a company's debt relative to its earnings, we calculate its net debt divided by its earnings before interest, tax, depreciation, and amortization (EBITDA) and its earnings before interest and tax (EBIT) divided by its interest expense (its interest cover). Thus we consider debt relative to earnings both with and without depreciation and amortization expenses.
While Nelco's low debt to EBITDA ratio of 0.97 suggests only modest use of debt, the fact that EBIT only covered the interest expense by 5.5 times last year does give us pause. But the interest payments are certainly sufficient to have us thinking about how affordable its debt is. Importantly, Nelco's EBIT fell a jaw-dropping 23% in the last twelve months. If that decline continues then paying off debt will be harder than selling foie gras at a vegan convention. There's no doubt that we learn most about debt from the balance sheet. But it is Nelco's earnings that will influence how the balance sheet holds up in the future. So if you're keen to discover more about its earnings, it might be worth checking out this graph of its long term earnings trend.
Finally, while the tax-man may adore accounting profits, lenders only accept cold hard cash. So we always check how much of that EBIT is translated into free cash flow. Over the most recent three years, Nelco recorded free cash flow worth 80% of its EBIT, which is around normal, given free cash flow excludes interest and tax. This cold hard cash means it can reduce its debt when it wants to.
Our View
Nelco's EBIT growth rate was a real negative on this analysis, although the other factors we considered were considerably better. In particular, we are dazzled with its conversion of EBIT to free cash flow. Considering this range of data points, we think Nelco is in a good position to manage its debt levels. But a word of caution: we think debt levels are high enough to justify ongoing monitoring. Above most other metrics, we think its important to track how fast earnings per share is growing, if at all. If you've also come to that realization, you're in luck, because today you can view this interactive graph of Nelco's earnings per share history for free.
If you're interested in investing in businesses that can grow profits without the burden of debt, then check out this free list of growing businesses that have net cash on the balance sheet.
Valuation is complex, but we're here to simplify it.
Discover if Nelco might be undervalued or overvalued with our detailed analysis, featuring fair value estimates, potential risks, dividends, insider trades, and its financial condition.
Access Free AnalysisHave feedback on this article? Concerned about the content? Get in touch with us directly. Alternatively, email editorial-team (at) simplywallst.com.
This article by Simply Wall St is general in nature. We provide commentary based on historical data and analyst forecasts only using an unbiased methodology and our articles are not intended to be financial advice. It does not constitute a recommendation to buy or sell any stock, and does not take account of your objectives, or your financial situation. We aim to bring you long-term focused analysis driven by fundamental data. Note that our analysis may not factor in the latest price-sensitive company announcements or qualitative material. Simply Wall St has no position in any stocks mentioned.
About NSEI:NELCO
Nelco
Provides solutions in the areas of very small aperture terminals (VSAT) connectivity, satellite communication (Satcom) projects, and integrated security and surveillance solutions in India.
Flawless balance sheet with questionable track record.
Similar Companies
Market Insights

Advertisement
Community Narratives
A formidable player in AI and enterprise computing.
Fair Value US$210.00|3.9% overvalued
CO
Community Contributor
IREN's Bold Moves in Sustainable Bitcoin Mining & AI Data Centers
Fair Value US$89.00|21.8% undervalued
BL
Community Contributor
Cooling the Champions: The Aussie Tech Behind F1's Victories
Fair Value AU$12.40|40.6% undervalued
TR
Community Contributor