- India
- /
- Communications
- /
- NSEI:ITI
Are ITI Limited's (NSE:ITI) Mixed Financials The Reason For Its Gloomy Performance on The Stock Market?


With its stock down 18% over the past three months, it is easy to disregard ITI (NSE:ITI). It is possible that the markets have ignored the company's differing financials and decided to lean-in to the negative sentiment. Fundamentals usually dictate market outcomes so it makes sense to study the company's financials. Specifically, we decided to study ITI's ROE in this article.
ROE or return on equity is a useful tool to assess how effectively a company can generate returns on the investment it received from its shareholders. In short, ROE shows the profit each dollar generates with respect to its shareholder investments.
Check out our latest analysis for ITI
How To Calculate Return On Equity?
ROE can be calculated by using the formula:
Return on Equity = Net Profit (from continuing operations) ÷ Shareholders' Equity
So, based on the above formula, the ROE for ITI is:
2.7% = ₹682m ÷ ₹25b (Based on the trailing twelve months to December 2022).
The 'return' is the amount earned after tax over the last twelve months. That means that for every ₹1 worth of shareholders' equity, the company generated ₹0.03 in profit.
Why Is ROE Important For Earnings Growth?
Thus far, we have learned that ROE measures how efficiently a company is generating its profits. Based on how much of its profits the company chooses to reinvest or "retain", we are then able to evaluate a company's future ability to generate profits. Generally speaking, other things being equal, firms with a high return on equity and profit retention, have a higher growth rate than firms that don’t share these attributes.
A Side By Side comparison of ITI's Earnings Growth And 2.7% ROE
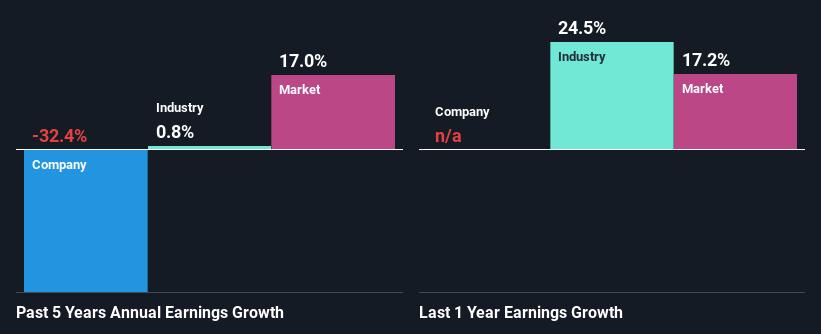
It is hard to argue that ITI's ROE is much good in and of itself. Even when compared to the industry average of 13%, the ROE figure is pretty disappointing. For this reason, ITI's five year net income decline of 32% is not surprising given its lower ROE. We reckon that there could also be other factors at play here. Such as - low earnings retention or poor allocation of capital.
However, when we compared ITI's growth with the industry we found that while the company's earnings have been shrinking, the industry has seen an earnings growth of 0.8% in the same period. This is quite worrisome.
Earnings growth is an important metric to consider when valuing a stock. What investors need to determine next is if the expected earnings growth, or the lack of it, is already built into the share price. By doing so, they will have an idea if the stock is headed into clear blue waters or if swampy waters await. One good indicator of expected earnings growth is the P/E ratio which determines the price the market is willing to pay for a stock based on its earnings prospects. So, you may want to check if ITI is trading on a high P/E or a low P/E, relative to its industry.
Is ITI Making Efficient Use Of Its Profits?
Because ITI doesn't pay any dividends, we infer that it is retaining all of its profits, which is rather perplexing when you consider the fact that there is no earnings growth to show for it. It looks like there might be some other reasons to explain the lack in that respect. For example, the business could be in decline.
Summary
Overall, we have mixed feelings about ITI. While the company does have a high rate of reinvestment, the low ROE means that all that reinvestment is not reaping any benefit to its investors, and moreover, its having a negative impact on the earnings growth. Wrapping up, we would proceed with caution with this company and one way of doing that would be to look at the risk profile of the business. You can see the 2 risks we have identified for ITI by visiting our risks dashboard for free on our platform here.
New: AI Stock Screener & Alerts
Our new AI Stock Screener scans the market every day to uncover opportunities.
• Dividend Powerhouses (3%+ Yield)
• Undervalued Small Caps with Insider Buying
• High growth Tech and AI Companies
Or build your own from over 50 metrics.
Have feedback on this article? Concerned about the content? Get in touch with us directly. Alternatively, email editorial-team (at) simplywallst.com.
This article by Simply Wall St is general in nature. We provide commentary based on historical data and analyst forecasts only using an unbiased methodology and our articles are not intended to be financial advice. It does not constitute a recommendation to buy or sell any stock, and does not take account of your objectives, or your financial situation. We aim to bring you long-term focused analysis driven by fundamental data. Note that our analysis may not factor in the latest price-sensitive company announcements or qualitative material. Simply Wall St has no position in any stocks mentioned.
About NSEI:ITI
ITI
Engages in the manufacture, sale, trading, and servicing of telecommunication equipment in India.
Mediocre balance sheet minimal.
Similar Companies
Market Insights

Community Narratives


