- India
- /
- Electronic Equipment and Components
- /
- NSEI:HONAUT
These 4 Measures Indicate That Honeywell Automation India (NSE:HONAUT) Is Using Debt Safely

Howard Marks put it nicely when he said that, rather than worrying about share price volatility, 'The possibility of permanent loss is the risk I worry about... and every practical investor I know worries about.' So it might be obvious that you need to consider debt, when you think about how risky any given stock is, because too much debt can sink a company. We can see that Honeywell Automation India Limited (NSE:HONAUT) does use debt in its business. But is this debt a concern to shareholders?
What Risk Does Debt Bring?
Debt assists a business until the business has trouble paying it off, either with new capital or with free cash flow. Part and parcel of capitalism is the process of 'creative destruction' where failed businesses are mercilessly liquidated by their bankers. While that is not too common, we often do see indebted companies permanently diluting shareholders because lenders force them to raise capital at a distressed price. Of course, the upside of debt is that it often represents cheap capital, especially when it replaces dilution in a company with the ability to reinvest at high rates of return. The first thing to do when considering how much debt a business uses is to look at its cash and debt together.
See our latest analysis for Honeywell Automation India
What Is Honeywell Automation India's Debt?
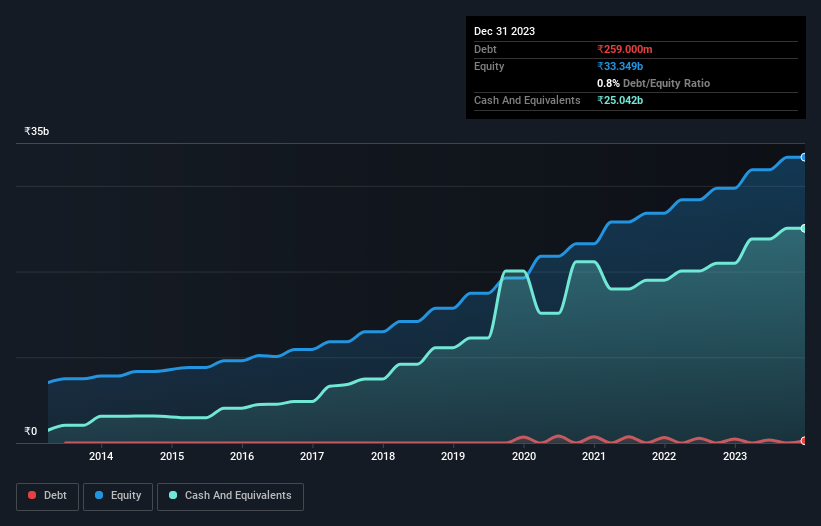
You can click the graphic below for the historical numbers, but it shows that Honeywell Automation India had ₹259.0m of debt in September 2023, down from ₹464.0m, one year before. But on the other hand it also has ₹25.0b in cash, leading to a ₹24.8b net cash position.
How Strong Is Honeywell Automation India's Balance Sheet?
We can see from the most recent balance sheet that Honeywell Automation India had liabilities of ₹13.0b falling due within a year, and liabilities of ₹295.0m due beyond that. On the other hand, it had cash of ₹25.0b and ₹10.0b worth of receivables due within a year. So it can boast ₹21.8b more liquid assets than total liabilities.
This short term liquidity is a sign that Honeywell Automation India could probably pay off its debt with ease, as its balance sheet is far from stretched. Simply put, the fact that Honeywell Automation India has more cash than debt is arguably a good indication that it can manage its debt safely.
Another good sign is that Honeywell Automation India has been able to increase its EBIT by 21% in twelve months, making it easier to pay down debt. There's no doubt that we learn most about debt from the balance sheet. But ultimately the future profitability of the business will decide if Honeywell Automation India can strengthen its balance sheet over time. So if you're focused on the future you can check out this free report showing analyst profit forecasts.
But our final consideration is also important, because a company cannot pay debt with paper profits; it needs cold hard cash. Honeywell Automation India may have net cash on the balance sheet, but it is still interesting to look at how well the business converts its earnings before interest and tax (EBIT) to free cash flow, because that will influence both its need for, and its capacity to manage debt. During the last three years, Honeywell Automation India produced sturdy free cash flow equating to 76% of its EBIT, about what we'd expect. This cold hard cash means it can reduce its debt when it wants to.
Summing Up
While we empathize with investors who find debt concerning, you should keep in mind that Honeywell Automation India has net cash of ₹24.8b, as well as more liquid assets than liabilities. And it impressed us with free cash flow of ₹4.1b, being 76% of its EBIT. So we don't think Honeywell Automation India's use of debt is risky. Above most other metrics, we think its important to track how fast earnings per share is growing, if at all. If you've also come to that realization, you're in luck, because today you can view this interactive graph of Honeywell Automation India's earnings per share history for free.
If you're interested in investing in businesses that can grow profits without the burden of debt, then check out this free list of growing businesses that have net cash on the balance sheet.
The New Payments ETF Is Live on NASDAQ:
Money is moving to real-time rails, and a newly listed ETF now gives investors direct exposure. Fast settlement. Institutional custody. Simple access.
Explore how this launch could reshape portfolios
Sponsored ContentValuation is complex, but we're here to simplify it.
Discover if Honeywell Automation India might be undervalued or overvalued with our detailed analysis, featuring fair value estimates, potential risks, dividends, insider trades, and its financial condition.
Access Free AnalysisHave feedback on this article? Concerned about the content? Get in touch with us directly. Alternatively, email editorial-team (at) simplywallst.com.
This article by Simply Wall St is general in nature. We provide commentary based on historical data and analyst forecasts only using an unbiased methodology and our articles are not intended to be financial advice. It does not constitute a recommendation to buy or sell any stock, and does not take account of your objectives, or your financial situation. We aim to bring you long-term focused analysis driven by fundamental data. Note that our analysis may not factor in the latest price-sensitive company announcements or qualitative material. Simply Wall St has no position in any stocks mentioned.
About NSEI:HONAUT
Honeywell Automation India
Manufactures and sells industrial process control and automation systems in India and internationally.
Flawless balance sheet established dividend payer.
Similar Companies
Market Insights

Weekly Picks

Early mover in a fast growing industry. Likely to experience share price volatility as they scale


A case for CA$31.80 (undiluted), aka 8,616% upside from CA$0.37 (an 86 bagger!).


Moderation and Stabilisation: HOLD: Fair Price based on a 4-year Cycle is $12.08
Recently Updated Narratives

Amazon: Why the World’s Biggest Platform Still Runs on Invisible Economics

Sunrun Stock: When the Energy Transition Collides With the Cost of Capital

Salesforce Stock: AI-Fueled Growth Is Real — But Can Margins Stay This Strong?
Popular Narratives


MicroVision will explode future revenue by 380.37% with a vision towards success


Crazy Undervalued 42 Baggers Silver Play (Active & Running Mine)


