
Advertisement
These Metrics Don't Make SecureKloud Technologies (NSE:SECURKLOUD) Look Too Strong
If you're looking at a mature business that's past the growth phase, what are some of the underlying trends that pop up? When we see a declining return on capital employed (ROCE) in conjunction with a declining base of capital employed, that's often how a mature business shows signs of aging. Trends like this ultimately mean the business is reducing its investments and also earning less on what it has invested. Having said that, after a brief look, SecureKloud Technologies (NSE:SECURKLOUD) we aren't filled with optimism, but let's investigate further.
What is Return On Capital Employed (ROCE)?
For those who don't know, ROCE is a measure of a company's yearly pre-tax profit (its return), relative to the capital employed in the business. To calculate this metric for SecureKloud Technologies, this is the formula:
Return on Capital Employed = Earnings Before Interest and Tax (EBIT) ÷ (Total Assets - Current Liabilities)
0.11 = ₹117m ÷ (₹2.4b - ₹1.4b) (Based on the trailing twelve months to December 2020).
Thus, SecureKloud Technologies has an ROCE of 11%. That's a relatively normal return on capital, and it's around the 12% generated by the Software industry.
Check out our latest analysis for SecureKloud Technologies
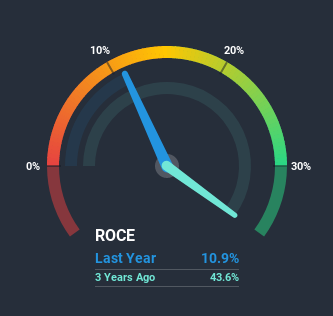
Historical performance is a great place to start when researching a stock so above you can see the gauge for SecureKloud Technologies' ROCE against it's prior returns. If you want to delve into the historical earnings, revenue and cash flow of SecureKloud Technologies, check out these free graphs here.
So How Is SecureKloud Technologies' ROCE Trending?
The trend of returns that SecureKloud Technologies is generating are raising some concerns. Unfortunately, returns have declined substantially over the last five years to the 11% we see today. In addition to that, SecureKloud Technologies is now employing 52% less capital than it was five years ago. The fact that both are shrinking is an indication that the business is going through some tough times. Typically businesses that exhibit these characteristics aren't the ones that tend to multiply over the long term, because statistically speaking, they've already gone through the growth phase of their life cycle.
While on the subject, we noticed that the ratio of current liabilities to total assets has risen to 56%, which has impacted the ROCE. Without this increase, it's likely that ROCE would be even lower than 11%. What this means is that in reality, a rather large portion of the business is being funded by the likes of the company's suppliers or short-term creditors, which can bring some risks of its own.
Our Take On SecureKloud Technologies' ROCE
In short, lower returns and decreasing amounts capital employed in the business doesn't fill us with confidence. Unsurprisingly then, the stock has dived 86% over the last five years, so investors are recognizing these changes and don't like the company's prospects. With underlying trends that aren't great in these areas, we'd consider looking elsewhere.
SecureKloud Technologies does come with some risks though, we found 4 warning signs in our investment analysis, and 1 of those is significant...
If you want to search for solid companies with great earnings, check out this free list of companies with good balance sheets and impressive returns on equity.
If you decide to trade SecureKloud Technologies, use the lowest-cost* platform that is rated #1 Overall by Barron’s, Interactive Brokers. Trade stocks, options, futures, forex, bonds and funds on 135 markets, all from a single integrated account. Promoted
New: Manage All Your Stock Portfolios in One Place
We've created the ultimate portfolio companion for stock investors, and it's free.
• Connect an unlimited number of Portfolios and see your total in one currency
• Be alerted to new Warning Signs or Risks via email or mobile
• Track the Fair Value of your stocks
This article by Simply Wall St is general in nature. It does not constitute a recommendation to buy or sell any stock, and does not take account of your objectives, or your financial situation. We aim to bring you long-term focused analysis driven by fundamental data. Note that our analysis may not factor in the latest price-sensitive company announcements or qualitative material. Simply Wall St has no position in any stocks mentioned.
*Interactive Brokers Rated Lowest Cost Broker by StockBrokers.com Annual Online Review 2020
Have feedback on this article? Concerned about the content? Get in touch with us directly. Alternatively, email editorial-team (at) simplywallst.com.
About NSEI:SECURKLOUD
SecureKloud Technologies
Provides information and technology services in India and the United States.
Slight risk and slightly overvalued.
Similar Companies
Market Insights

Advertisement
Weekly Picks
WO

woodworthfund on MGP Ingredients ·
THE KINGDOM OF BROWN GOODS: WHY MGPI IS BEING CRUSHED BY INVENTORY & PRIMED FOR RESURRECTION
Fair Value:US$4034.1% undervalued
19 followersusers have followed this narrative
1 commentusers have commented on this narrative
5 likesusers have liked this narrative
DO


Double_Bubbler on Vertical Aerospace ·
Why Vertical Aerospace (NYSE: EVTL) is Worth Possibly Over 13x its Current Price
Fair Value:US$6089.9% undervalued
22 followersusers have followed this narrative
2 commentsusers have commented on this narrative
17 likesusers have liked this narrative
TI


TickerTickle on Oracle ·
The Quiet Giant That Became AI’s Power Grid
Fair Value:US$389.8149.0% undervalued
42 followersusers have followed this narrative
3 commentsusers have commented on this narrative
8 likesusers have liked this narrative
Recently Updated Narratives
KI

KiwiInvest on Rocket Lab ·
Rocket Lab USA Will Ignite a 30% Revenue Growth Journey
Fair Value:US$97.8335.1% undervalued
136 followersusers have followed this narrative
8 commentsusers have commented on this narrative
0 likesusers have liked this narrative
MH


mhbb on Mastersystem Infotama ·
Mastersystem Infotama will achieve 18.9% revenue growth as fair value hits IDR1,650
Fair Value:Rp1.63k13.8% undervalued
1 followerusers have followed this narrative
0 commentsusers have commented on this narrative
0 likesusers have liked this narrative
RO


Robbo on Procter & Gamble ·
Insiders Sell, Investors Watch: What’s Going On at PG?
Fair Value:US$1506.2% undervalued
2 followersusers have followed this narrative
0 commentsusers have commented on this narrative
0 likesusers have liked this narrative
Popular Narratives
TH


TheWallstreetKing on MicroVision ·
MicroVision will explode future revenue by 380.37% with a vision towards success
Fair Value:US$6098.5% undervalued
119 followersusers have followed this narrative
11 commentsusers have commented on this narrative
22 likesusers have liked this narrative
AN


AnalystConsensusTarget on NVIDIA ·
NVDA: Expanding AI Demand Will Drive Major Data Center Investments Through 2026
Fair Value:US$250.3927.7% undervalued
963 followersusers have followed this narrative
6 commentsusers have commented on this narrative
25 likesusers have liked this narrative
RO


RockeTeller on Santacruz Silver Mining ·
Crazy Undervalued 42 Baggers Silver Play (Active & Running Mine)
Fair Value:CA$8683.3% undervalued
77 followersusers have followed this narrative
8 commentsusers have commented on this narrative
21 likesusers have liked this narrative
Trending Discussion

OI


OilStates on Oil States International ·
The article’s takeaways do not reflect Oil States’ current business mix or market realities. Nearly 75% of Company revenues now come from offshore and international projects, where industry investment is strengthening, not declining, and backlog is at the highest level in a decade. Oil States has intentionally exited lower-margin U.S. land markets, resulting in expanding margins, strong free cash flow, and a near-zero net-debt profile. Our offerings are concentrated in high-barrier, engineered offshore technologies where competitive pressure and regulatory risk are far lower than implied. These fundamentals therefore do not align with the structural-decline narrative presented. Find out more about the strong offshore/international, cash generation, and valuation upside potential in our latest investor presentation available here: https://ir.oilstatesintl.com/events-and-presentations/default.aspx
0
|0