
Advertisement
Warren Buffett famously said, 'Volatility is far from synonymous with risk.' So it seems the smart money knows that debt - which is usually involved in bankruptcies - is a very important factor, when you assess how risky a company is. We note that Kck Industries Limited (NSE:KCK) does have debt on its balance sheet. But the real question is whether this debt is making the company risky.
Why Does Debt Bring Risk?
Generally speaking, debt only becomes a real problem when a company can't easily pay it off, either by raising capital or with its own cash flow. In the worst case scenario, a company can go bankrupt if it cannot pay its creditors. However, a more usual (but still expensive) situation is where a company must dilute shareholders at a cheap share price simply to get debt under control. Of course, debt can be an important tool in businesses, particularly capital heavy businesses. When we examine debt levels, we first consider both cash and debt levels, together.
View our latest analysis for Kck Industries
What Is Kck Industries's Net Debt?
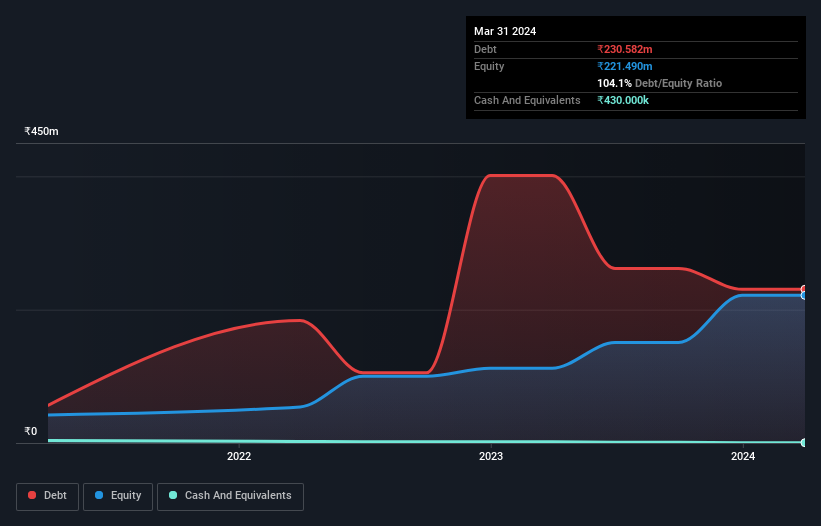
As you can see below, Kck Industries had ₹230.6m of debt at March 2024, down from ₹401.3m a year prior. Net debt is about the same, since the it doesn't have much cash.
How Strong Is Kck Industries' Balance Sheet?
We can see from the most recent balance sheet that Kck Industries had liabilities of ₹215.7m falling due within a year, and liabilities of ₹72.1m due beyond that. Offsetting these obligations, it had cash of ₹430.0k as well as receivables valued at ₹49.1m due within 12 months. So its liabilities outweigh the sum of its cash and (near-term) receivables by ₹238.3m.
Of course, Kck Industries has a market capitalization of ₹1.55b, so these liabilities are probably manageable. However, we do think it is worth keeping an eye on its balance sheet strength, as it may change over time.
In order to size up a company's debt relative to its earnings, we calculate its net debt divided by its earnings before interest, tax, depreciation, and amortization (EBITDA) and its earnings before interest and tax (EBIT) divided by its interest expense (its interest cover). This way, we consider both the absolute quantum of the debt, as well as the interest rates paid on it.
While we wouldn't worry about Kck Industries's net debt to EBITDA ratio of 4.2, we think its super-low interest cover of 1.8 times is a sign of high leverage. So shareholders should probably be aware that interest expenses appear to have really impacted the business lately. Looking on the bright side, Kck Industries boosted its EBIT by a silky 33% in the last year. Like a mother's loving embrace of a newborn that sort of growth builds resilience, putting the company in a stronger position to manage its debt. When analysing debt levels, the balance sheet is the obvious place to start. But it is Kck Industries's earnings that will influence how the balance sheet holds up in the future. So if you're keen to discover more about its earnings, it might be worth checking out this graph of its long term earnings trend.
Finally, a business needs free cash flow to pay off debt; accounting profits just don't cut it. So the logical step is to look at the proportion of that EBIT that is matched by actual free cash flow. Over the last three years, Kck Industries saw substantial negative free cash flow, in total. While investors are no doubt expecting a reversal of that situation in due course, it clearly does mean its use of debt is more risky.
Our View
Kck Industries's conversion of EBIT to free cash flow and interest cover definitely weigh on it, in our esteem. But the good news is it seems to be able to grow its EBIT with ease. We think that Kck Industries's debt does make it a bit risky, after considering the aforementioned data points together. That's not necessarily a bad thing, since leverage can boost returns on equity, but it is something to be aware of. When analysing debt levels, the balance sheet is the obvious place to start. However, not all investment risk resides within the balance sheet - far from it. To that end, you should learn about the 3 warning signs we've spotted with Kck Industries (including 2 which shouldn't be ignored) .
If you're interested in investing in businesses that can grow profits without the burden of debt, then check out this free list of growing businesses that have net cash on the balance sheet.
Valuation is complex, but we're here to simplify it.
Discover if Kck Industries might be undervalued or overvalued with our detailed analysis, featuring fair value estimates, potential risks, dividends, insider trades, and its financial condition.
Access Free AnalysisHave feedback on this article? Concerned about the content? Get in touch with us directly. Alternatively, email editorial-team (at) simplywallst.com.
This article by Simply Wall St is general in nature. We provide commentary based on historical data and analyst forecasts only using an unbiased methodology and our articles are not intended to be financial advice. It does not constitute a recommendation to buy or sell any stock, and does not take account of your objectives, or your financial situation. We aim to bring you long-term focused analysis driven by fundamental data. Note that our analysis may not factor in the latest price-sensitive company announcements or qualitative material. Simply Wall St has no position in any stocks mentioned.
About NSEI:KCK
Kck Industries
Engages in the trading and distribution of combed and carded cotton yarns in India.
Moderate risk with acceptable track record.
Similar Companies
Market Insights

Advertisement
Community Narratives
A formidable player in AI and enterprise computing.
Fair Value US$210.00|12.2% overvalued
CO
Community Contributor
IREN's Bold Moves in Sustainable Bitcoin Mining & AI Data Centers
Fair Value US$72.52|17.1% undervalued
BL
Community Contributor
Cooling the Champions: The Aussie Tech Behind F1's Victories
Fair Value AU$12.40|38.7% undervalued
TR
Community Contributor