- India
- /
- Retail Distributors
- /
- NSEI:IMPAL
India Motor Parts & Accessories (NSE:IMPAL) jumps 14% this week, though earnings growth is still tracking behind three-year shareholder returns


Vanguard founder Jack Bogle helped spearhead the low-cost index fund, putting average returns within reach of every investor. But if you pick the right individual stocks, you could make more than that. Notably, the India Motor Parts & Accessories Limited (NSE:IMPAL) share price has gained 76% in three years, which is better than the average market return. Also positive was the solid 28% share price increase over the last twelve months.
On the back of a solid 7-day performance, let's check what role the company's fundamentals have played in driving long term shareholder returns.
Check out our latest analysis for India Motor Parts & Accessories
While the efficient markets hypothesis continues to be taught by some, it has been proven that markets are over-reactive dynamic systems, and investors are not always rational. By comparing earnings per share (EPS) and share price changes over time, we can get a feel for how investor attitudes to a company have morphed over time.
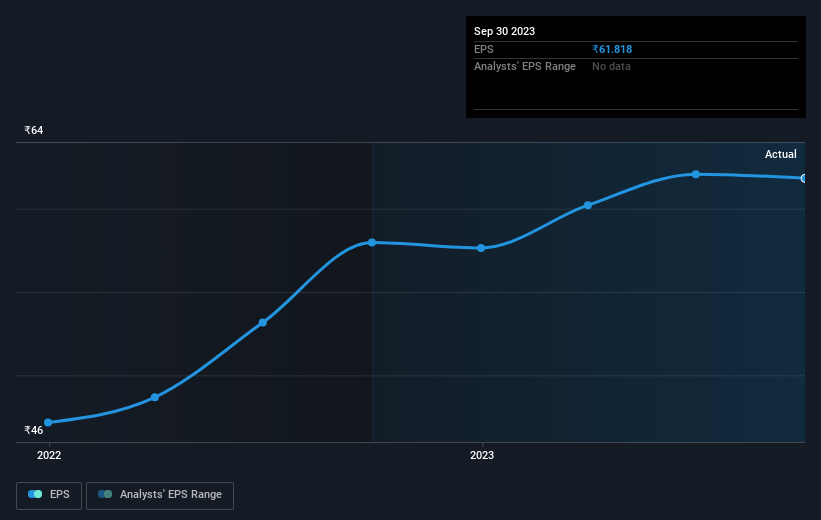
India Motor Parts & Accessories was able to grow its EPS at 24% per year over three years, sending the share price higher. We note that the 21% yearly (average) share price gain isn't too far from the EPS growth rate. Coincidence? Probably not. This suggests that sentiment and expectations have not changed drastically. Au contraire, the share price change has arguably mimicked the EPS growth.
The image below shows how EPS has tracked over time (if you click on the image you can see greater detail).
This free interactive report on India Motor Parts & Accessories' earnings, revenue and cash flow is a great place to start, if you want to investigate the stock further.
What About Dividends?
It is important to consider the total shareholder return, as well as the share price return, for any given stock. The TSR incorporates the value of any spin-offs or discounted capital raisings, along with any dividends, based on the assumption that the dividends are reinvested. Arguably, the TSR gives a more comprehensive picture of the return generated by a stock. In the case of India Motor Parts & Accessories, it has a TSR of 87% for the last 3 years. That exceeds its share price return that we previously mentioned. The dividends paid by the company have thusly boosted the total shareholder return.
A Different Perspective
We're pleased to report that India Motor Parts & Accessories shareholders have received a total shareholder return of 32% over one year. And that does include the dividend. That gain is better than the annual TSR over five years, which is 11%. Therefore it seems like sentiment around the company has been positive lately. Given the share price momentum remains strong, it might be worth taking a closer look at the stock, lest you miss an opportunity. It's always interesting to track share price performance over the longer term. But to understand India Motor Parts & Accessories better, we need to consider many other factors. Take risks, for example - India Motor Parts & Accessories has 1 warning sign we think you should be aware of.
If you would prefer to check out another company -- one with potentially superior financials -- then do not miss this free list of companies that have proven they can grow earnings.
Please note, the market returns quoted in this article reflect the market weighted average returns of stocks that currently trade on Indian exchanges.
New: AI Stock Screener & Alerts
Our new AI Stock Screener scans the market every day to uncover opportunities.
• Dividend Powerhouses (3%+ Yield)
• Undervalued Small Caps with Insider Buying
• High growth Tech and AI Companies
Or build your own from over 50 metrics.
Have feedback on this article? Concerned about the content? Get in touch with us directly. Alternatively, email editorial-team (at) simplywallst.com.
This article by Simply Wall St is general in nature. We provide commentary based on historical data and analyst forecasts only using an unbiased methodology and our articles are not intended to be financial advice. It does not constitute a recommendation to buy or sell any stock, and does not take account of your objectives, or your financial situation. We aim to bring you long-term focused analysis driven by fundamental data. Note that our analysis may not factor in the latest price-sensitive company announcements or qualitative material. Simply Wall St has no position in any stocks mentioned.
About NSEI:IMPAL
India Motor Parts & Accessories
Sells and distributes automobile spare parts and accessories in India.
Flawless balance sheet established dividend payer.
Market Insights

Community Narratives

