
Advertisement
Are Strong Financial Prospects The Force That Is Driving The Momentum In Sat Kartar Shopping Limited's NSE:SATKARTAR) Stock?
Sat Kartar Shopping (NSE:SATKARTAR) has had a great run on the share market with its stock up by a significant 13% over the last week. Given that the market rewards strong financials in the long-term, we wonder if that is the case in this instance. Particularly, we will be paying attention to Sat Kartar Shopping's ROE today.
ROE or return on equity is a useful tool to assess how effectively a company can generate returns on the investment it received from its shareholders. In short, ROE shows the profit each dollar generates with respect to its shareholder investments.
How Is ROE Calculated?
ROE can be calculated by using the formula:
Return on Equity = Net Profit (from continuing operations) ÷ Shareholders' Equity
So, based on the above formula, the ROE for Sat Kartar Shopping is:
19% = ₹98m ÷ ₹515m (Based on the trailing twelve months to March 2025).
The 'return' is the yearly profit. One way to conceptualize this is that for each ₹1 of shareholders' capital it has, the company made ₹0.19 in profit.
See our latest analysis for Sat Kartar Shopping
What Has ROE Got To Do With Earnings Growth?
So far, we've learned that ROE is a measure of a company's profitability. We now need to evaluate how much profit the company reinvests or "retains" for future growth which then gives us an idea about the growth potential of the company. Assuming everything else remains unchanged, the higher the ROE and profit retention, the higher the growth rate of a company compared to companies that don't necessarily bear these characteristics.
A Side By Side comparison of Sat Kartar Shopping's Earnings Growth And 19% ROE
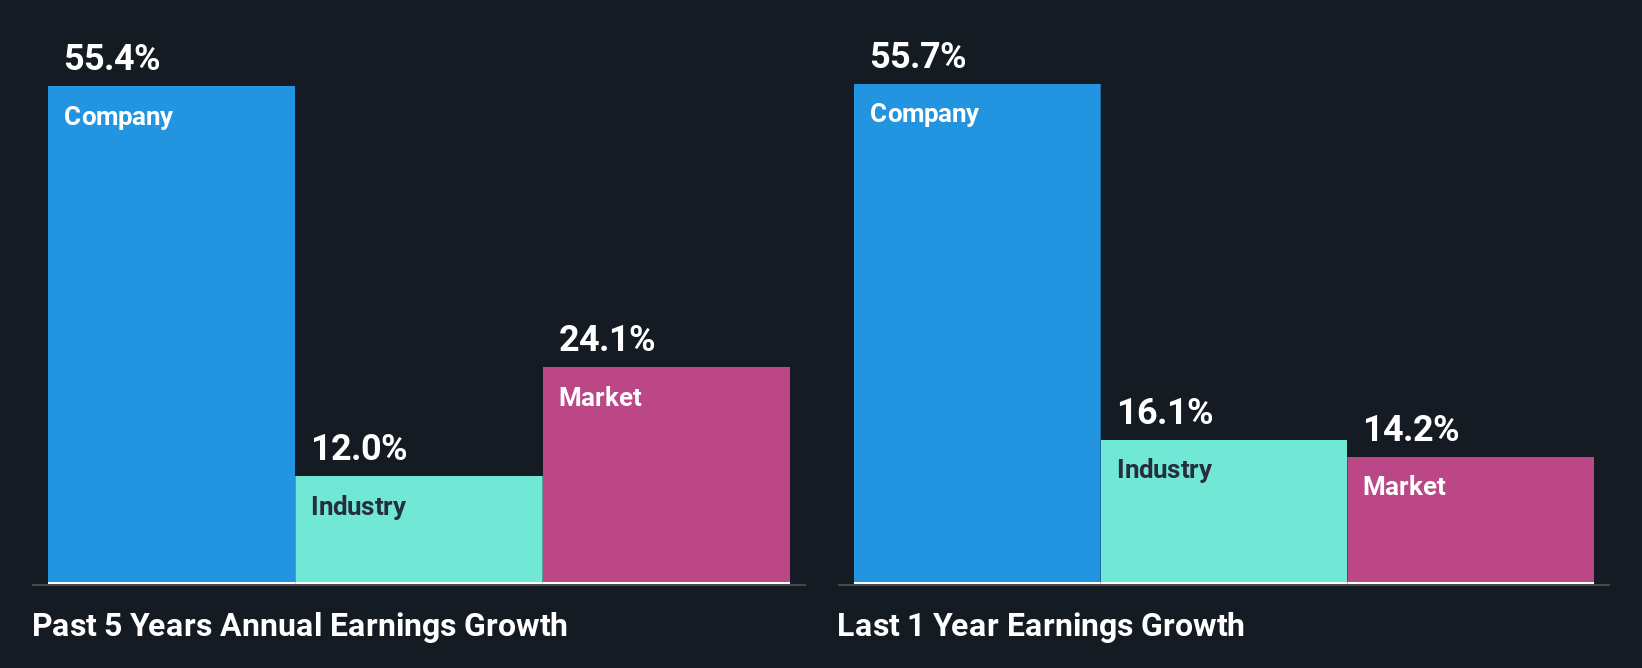
At first glance, Sat Kartar Shopping seems to have a decent ROE. Further, the company's ROE compares quite favorably to the industry average of 12%. Probably as a result of this, Sat Kartar Shopping was able to see an impressive net income growth of 55% over the last five years. We reckon that there could also be other factors at play here. Such as - high earnings retention or an efficient management in place.
Next, on comparing with the industry net income growth, we found that Sat Kartar Shopping's growth is quite high when compared to the industry average growth of 12% in the same period, which is great to see.
The basis for attaching value to a company is, to a great extent, tied to its earnings growth. The investor should try to establish if the expected growth or decline in earnings, whichever the case may be, is priced in. By doing so, they will have an idea if the stock is headed into clear blue waters or if swampy waters await. Is Sat Kartar Shopping fairly valued compared to other companies? These 3 valuation measures might help you decide.
Is Sat Kartar Shopping Using Its Retained Earnings Effectively?
Sat Kartar Shopping's ' three-year median payout ratio is on the lower side at 5.6% implying that it is retaining a higher percentage (94%) of its profits. So it looks like Sat Kartar Shopping is reinvesting profits heavily to grow its business, which shows in its earnings growth.
Summary
In total, we are pretty happy with Sat Kartar Shopping's performance. Specifically, we like that the company is reinvesting a huge chunk of its profits at a high rate of return. This of course has caused the company to see substantial growth in its earnings. If the company continues to grow its earnings the way it has, that could have a positive impact on its share price given how earnings per share influence long-term share prices. Let's not forget, business risk is also one of the factors that affects the price of the stock. So this is also an important area that investors need to pay attention to before making a decision on any business. You can see the 4 risks we have identified for Sat Kartar Shopping by visiting our risks dashboard for free on our platform here.
New: Manage All Your Stock Portfolios in One Place
We've created the ultimate portfolio companion for stock investors, and it's free.
• Connect an unlimited number of Portfolios and see your total in one currency
• Be alerted to new Warning Signs or Risks via email or mobile
• Track the Fair Value of your stocks
Have feedback on this article? Concerned about the content? Get in touch with us directly. Alternatively, email editorial-team (at) simplywallst.com.
This article by Simply Wall St is general in nature. We provide commentary based on historical data and analyst forecasts only using an unbiased methodology and our articles are not intended to be financial advice. It does not constitute a recommendation to buy or sell any stock, and does not take account of your objectives, or your financial situation. We aim to bring you long-term focused analysis driven by fundamental data. Note that our analysis may not factor in the latest price-sensitive company announcements or qualitative material. Simply Wall St has no position in any stocks mentioned.
About NSEI:SATKARTAR
Sat Kartar Shopping
An ayurvedic healthcare company, provides ayurvedic products in India.
Excellent balance sheet with proven track record.
Similar Companies
Market Insights

Advertisement
Community Narratives
A formidable player in AI and enterprise computing.
Fair Value US$210.00|13.6% overvalued
CO
Community Contributor
IREN's Bold Moves in Sustainable Bitcoin Mining & AI Data Centers
Fair Value US$89.00|23.6% undervalued
BL
Community Contributor
Cooling the Champions: The Aussie Tech Behind F1's Victories
Fair Value AU$12.40|40.6% undervalued
TR
Community Contributor