Estimating The Fair Value Of Piramal Pharma Limited (NSE:PPLPHARMA)


Key Insights
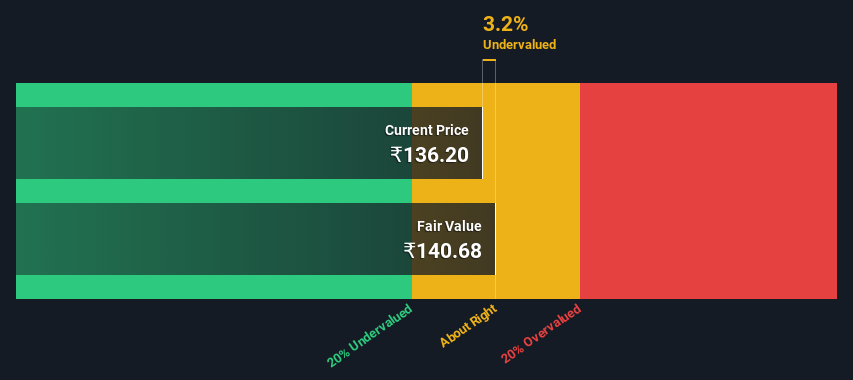
- Using the 2 Stage Free Cash Flow to Equity, Piramal Pharma fair value estimate is ₹141
- Piramal Pharma's ₹136 share price indicates it is trading at similar levels as its fair value estimate
- Our fair value estimate is 16% lower than Piramal Pharma's analyst price target of ₹167
Today we will run through one way of estimating the intrinsic value of Piramal Pharma Limited (NSE:PPLPHARMA) by taking the forecast future cash flows of the company and discounting them back to today's value. We will take advantage of the Discounted Cash Flow (DCF) model for this purpose. Believe it or not, it's not too difficult to follow, as you'll see from our example!
We generally believe that a company's value is the present value of all of the cash it will generate in the future. However, a DCF is just one valuation metric among many, and it is not without flaws. For those who are keen learners of equity analysis, the Simply Wall St analysis model here may be something of interest to you.
See our latest analysis for Piramal Pharma
Is Piramal Pharma Fairly Valued?
We're using the 2-stage growth model, which simply means we take in account two stages of company's growth. In the initial period the company may have a higher growth rate and the second stage is usually assumed to have a stable growth rate. To start off with, we need to estimate the next ten years of cash flows. Where possible we use analyst estimates, but when these aren't available we extrapolate the previous free cash flow (FCF) from the last estimate or reported value. We assume companies with shrinking free cash flow will slow their rate of shrinkage, and that companies with growing free cash flow will see their growth rate slow, over this period. We do this to reflect that growth tends to slow more in the early years than it does in later years.
Generally we assume that a dollar today is more valuable than a dollar in the future, and so the sum of these future cash flows is then discounted to today's value:
10-year free cash flow (FCF) estimate
| 2024 | 2025 | 2026 | 2027 | 2028 | 2029 | 2030 | 2031 | 2032 | 2033 | |
| Levered FCF (₹, Millions) | ₹2.97b | ₹4.43b | ₹7.44b | ₹10.0b | ₹12.7b | ₹15.3b | ₹17.7b | ₹20.1b | ₹22.4b | ₹24.7b |
| Growth Rate Estimate Source | Analyst x2 | Analyst x2 | Analyst x2 | Est @ 34.69% | Est @ 26.30% | Est @ 20.42% | Est @ 16.31% | Est @ 13.43% | Est @ 11.41% | Est @ 10.00% |
| Present Value (₹, Millions) Discounted @ 13% | ₹2.6k | ₹3.5k | ₹5.2k | ₹6.2k | ₹6.9k | ₹7.3k | ₹7.6k | ₹7.6k | ₹7.5k | ₹7.3k |
("Est" = FCF growth rate estimated by Simply Wall St)
Present Value of 10-year Cash Flow (PVCF) = ₹62b
We now need to calculate the Terminal Value, which accounts for all the future cash flows after this ten year period. The Gordon Growth formula is used to calculate Terminal Value at a future annual growth rate equal to the 5-year average of the 10-year government bond yield of 6.7%. We discount the terminal cash flows to today's value at a cost of equity of 13%.
Terminal Value (TV)= FCF2033 × (1 + g) ÷ (r – g) = ₹25b× (1 + 6.7%) ÷ (13%– 6.7%) = ₹421b
Present Value of Terminal Value (PVTV)= TV / (1 + r)10= ₹421b÷ ( 1 + 13%)10= ₹125b
The total value, or equity value, is then the sum of the present value of the future cash flows, which in this case is ₹186b. To get the intrinsic value per share, we divide this by the total number of shares outstanding. Compared to the current share price of ₹136, the company appears about fair value at a 3.2% discount to where the stock price trades currently. The assumptions in any calculation have a big impact on the valuation, so it is better to view this as a rough estimate, not precise down to the last cent.
Important Assumptions
We would point out that the most important inputs to a discounted cash flow are the discount rate and of course the actual cash flows. Part of investing is coming up with your own evaluation of a company's future performance, so try the calculation yourself and check your own assumptions. The DCF also does not consider the possible cyclicality of an industry, or a company's future capital requirements, so it does not give a full picture of a company's potential performance. Given that we are looking at Piramal Pharma as potential shareholders, the cost of equity is used as the discount rate, rather than the cost of capital (or weighted average cost of capital, WACC) which accounts for debt. In this calculation we've used 13%, which is based on a levered beta of 0.800. Beta is a measure of a stock's volatility, compared to the market as a whole. We get our beta from the industry average beta of globally comparable companies, with an imposed limit between 0.8 and 2.0, which is a reasonable range for a stable business.
SWOT Analysis for Piramal Pharma
- No major strengths identified for PPLPHARMA.
- Interest payments on debt are not well covered.
- Shareholders have been diluted in the past year.
- Expected to breakeven next year.
- Has sufficient cash runway for more than 3 years based on current free cash flows.
- Good value based on P/S ratio and estimated fair value.
- Debt is not well covered by operating cash flow.
Moving On:
Whilst important, the DCF calculation ideally won't be the sole piece of analysis you scrutinize for a company. DCF models are not the be-all and end-all of investment valuation. Instead the best use for a DCF model is to test certain assumptions and theories to see if they would lead to the company being undervalued or overvalued. If a company grows at a different rate, or if its cost of equity or risk free rate changes sharply, the output can look very different. For Piramal Pharma, we've put together three fundamental aspects you should look at:
- Risks: For example, we've discovered 2 warning signs for Piramal Pharma (1 is a bit concerning!) that you should be aware of before investing here.
- Future Earnings: How does PPLPHARMA's growth rate compare to its peers and the wider market? Dig deeper into the analyst consensus number for the upcoming years by interacting with our free analyst growth expectation chart.
- Other Solid Businesses: Low debt, high returns on equity and good past performance are fundamental to a strong business. Why not explore our interactive list of stocks with solid business fundamentals to see if there are other companies you may not have considered!
PS. The Simply Wall St app conducts a discounted cash flow valuation for every stock on the NSEI every day. If you want to find the calculation for other stocks just search here.
If you're looking to trade Piramal Pharma, open an account with the lowest-cost platform trusted by professionals, Interactive Brokers.
With clients in over 200 countries and territories, and access to 160 markets, IBKR lets you trade stocks, options, futures, forex, bonds and funds from a single integrated account.
Enjoy no hidden fees, no account minimums, and FX conversion rates as low as 0.03%, far better than what most brokers offer.
Sponsored ContentNew: Manage All Your Stock Portfolios in One Place
We've created the ultimate portfolio companion for stock investors, and it's free.
• Connect an unlimited number of Portfolios and see your total in one currency
• Be alerted to new Warning Signs or Risks via email or mobile
• Track the Fair Value of your stocks
Have feedback on this article? Concerned about the content? Get in touch with us directly. Alternatively, email editorial-team (at) simplywallst.com.
This article by Simply Wall St is general in nature. We provide commentary based on historical data and analyst forecasts only using an unbiased methodology and our articles are not intended to be financial advice. It does not constitute a recommendation to buy or sell any stock, and does not take account of your objectives, or your financial situation. We aim to bring you long-term focused analysis driven by fundamental data. Note that our analysis may not factor in the latest price-sensitive company announcements or qualitative material. Simply Wall St has no position in any stocks mentioned.
About NSEI:PPLPHARMA
Piramal Pharma
Operates as a pharmaceutical company in North America, Europe, Japan, India, and internationally.
Reasonable growth potential with proven track record.
Similar Companies
Market Insights

Community Narratives


