J. B. Chemicals & Pharmaceuticals Limited's (NSE:JBCHEPHARM) Stock Been Rising: Are Strong Financials Guiding The Market?


J. B. Chemicals & Pharmaceuticals' (NSE:JBCHEPHARM) stock is up by 4.9% over the past three months. Given that the market rewards strong financials in the long-term, we wonder if that is the case in this instance. Specifically, we decided to study J. B. Chemicals & Pharmaceuticals' ROE in this article.
Return on equity or ROE is a key measure used to assess how efficiently a company's management is utilizing the company's capital. Simply put, it is used to assess the profitability of a company in relation to its equity capital.
See our latest analysis for J. B. Chemicals & Pharmaceuticals
How Is ROE Calculated?
Return on equity can be calculated by using the formula:
Return on Equity = Net Profit (from continuing operations) ÷ Shareholders' Equity
So, based on the above formula, the ROE for J. B. Chemicals & Pharmaceuticals is:
17% = ₹4.1b ÷ ₹25b (Based on the trailing twelve months to March 2023).
The 'return' is the income the business earned over the last year. That means that for every ₹1 worth of shareholders' equity, the company generated ₹0.17 in profit.
What Has ROE Got To Do With Earnings Growth?
Thus far, we have learned that ROE measures how efficiently a company is generating its profits. Depending on how much of these profits the company reinvests or "retains", and how effectively it does so, we are then able to assess a company’s earnings growth potential. Assuming all else is equal, companies that have both a higher return on equity and higher profit retention are usually the ones that have a higher growth rate when compared to companies that don't have the same features.
A Side By Side comparison of J. B. Chemicals & Pharmaceuticals' Earnings Growth And 17% ROE
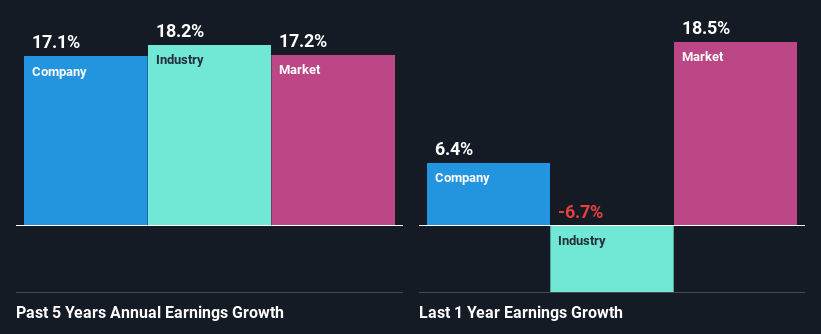
At first glance, J. B. Chemicals & Pharmaceuticals seems to have a decent ROE. Especially when compared to the industry average of 12% the company's ROE looks pretty impressive. This certainly adds some context to J. B. Chemicals & Pharmaceuticals' decent 17% net income growth seen over the past five years.
As a next step, we compared J. B. Chemicals & Pharmaceuticals' net income growth with the industry and found that the company has a similar growth figure when compared with the industry average growth rate of 18% in the same period.
The basis for attaching value to a company is, to a great extent, tied to its earnings growth. The investor should try to establish if the expected growth or decline in earnings, whichever the case may be, is priced in. Doing so will help them establish if the stock's future looks promising or ominous. One good indicator of expected earnings growth is the P/E ratio which determines the price the market is willing to pay for a stock based on its earnings prospects. So, you may want to check if J. B. Chemicals & Pharmaceuticals is trading on a high P/E or a low P/E, relative to its industry.
Is J. B. Chemicals & Pharmaceuticals Making Efficient Use Of Its Profits?
J. B. Chemicals & Pharmaceuticals has a three-year median payout ratio of 31%, which implies that it retains the remaining 69% of its profits. This suggests that its dividend is well covered, and given the decent growth seen by the company, it looks like management is reinvesting its earnings efficiently.
Moreover, J. B. Chemicals & Pharmaceuticals is determined to keep sharing its profits with shareholders which we infer from its long history of paying a dividend for at least ten years. Upon studying the latest analysts' consensus data, we found that the company's future payout ratio is expected to drop to 10% over the next three years. Despite the lower expected payout ratio, the company's ROE is not expected to change by much.
Conclusion
Overall, we are quite pleased with J. B. Chemicals & Pharmaceuticals' performance. In particular, it's great to see that the company is investing heavily into its business and along with a high rate of return, that has resulted in a sizeable growth in its earnings. That being so, the latest analyst forecasts show that the company will continue to see an expansion in its earnings. Are these analysts expectations based on the broad expectations for the industry, or on the company's fundamentals? Click here to be taken to our analyst's forecasts page for the company.
New: Manage All Your Stock Portfolios in One Place
We've created the ultimate portfolio companion for stock investors, and it's free.
• Connect an unlimited number of Portfolios and see your total in one currency
• Be alerted to new Warning Signs or Risks via email or mobile
• Track the Fair Value of your stocks
Have feedback on this article? Concerned about the content? Get in touch with us directly. Alternatively, email editorial-team (at) simplywallst.com.
This article by Simply Wall St is general in nature. We provide commentary based on historical data and analyst forecasts only using an unbiased methodology and our articles are not intended to be financial advice. It does not constitute a recommendation to buy or sell any stock, and does not take account of your objectives, or your financial situation. We aim to bring you long-term focused analysis driven by fundamental data. Note that our analysis may not factor in the latest price-sensitive company announcements or qualitative material. Simply Wall St has no position in any stocks mentioned.
About NSEI:JBCHEPHARM
J. B. Chemicals & Pharmaceuticals
Manufactures and markets pharmaceutical formulations, herbal remedies, and active pharmaceutical ingredients (API) in India and internationally.
Flawless balance sheet with reasonable growth potential and pays a dividend.
Similar Companies
Market Insights

Community Narratives


