
Advertisement

Legendary fund manager Li Lu (who Charlie Munger backed) once said, 'The biggest investment risk is not the volatility of prices, but whether you will suffer a permanent loss of capital.' It's only natural to consider a company's balance sheet when you examine how risky it is, since debt is often involved when a business collapses. We can see that Cipla Limited (NSE:CIPLA) does use debt in its business. But is this debt a concern to shareholders?
When Is Debt Dangerous?
Debt assists a business until the business has trouble paying it off, either with new capital or with free cash flow. In the worst case scenario, a company can go bankrupt if it cannot pay its creditors. However, a more common (but still painful) scenario is that it has to raise new equity capital at a low price, thus permanently diluting shareholders. Of course, the upside of debt is that it often represents cheap capital, especially when it replaces dilution in a company with the ability to reinvest at high rates of return. When we think about a company's use of debt, we first look at cash and debt together.
View our latest analysis for Cipla
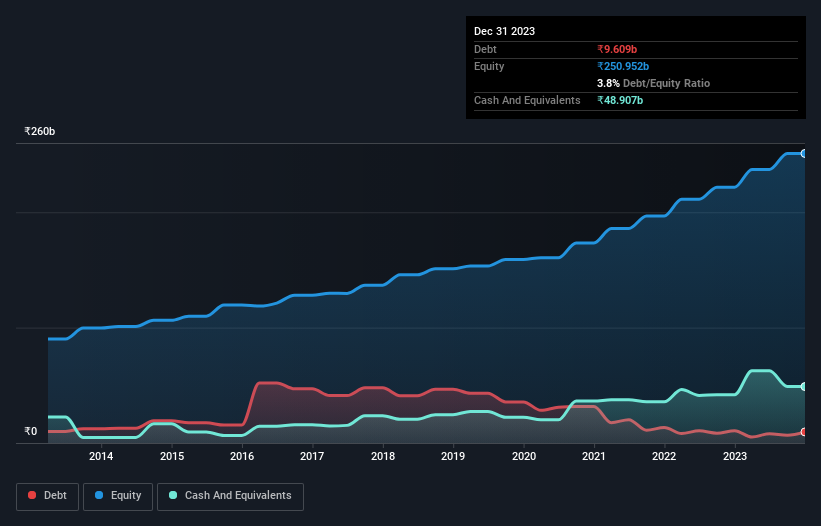
What Is Cipla's Debt?
You can click the graphic below for the historical numbers, but it shows that Cipla had ₹9.61b of debt in September 2023, down from ₹10.7b, one year before. However, its balance sheet shows it holds ₹48.9b in cash, so it actually has ₹39.3b net cash.
How Strong Is Cipla's Balance Sheet?
Zooming in on the latest balance sheet data, we can see that Cipla had liabilities of ₹56.5b due within 12 months and liabilities of ₹6.33b due beyond that. Offsetting this, it had ₹48.9b in cash and ₹48.5b in receivables that were due within 12 months. So it can boast ₹34.6b more liquid assets than total liabilities.
This short term liquidity is a sign that Cipla could probably pay off its debt with ease, as its balance sheet is far from stretched. Simply put, the fact that Cipla has more cash than debt is arguably a good indication that it can manage its debt safely.
In addition to that, we're happy to report that Cipla has boosted its EBIT by 46%, thus reducing the spectre of future debt repayments. There's no doubt that we learn most about debt from the balance sheet. But ultimately the future profitability of the business will decide if Cipla can strengthen its balance sheet over time. So if you're focused on the future you can check out this free report showing analyst profit forecasts.
Finally, a business needs free cash flow to pay off debt; accounting profits just don't cut it. While Cipla has net cash on its balance sheet, it's still worth taking a look at its ability to convert earnings before interest and tax (EBIT) to free cash flow, to help us understand how quickly it is building (or eroding) that cash balance. Over the most recent three years, Cipla recorded free cash flow worth 60% of its EBIT, which is around normal, given free cash flow excludes interest and tax. This cold hard cash means it can reduce its debt when it wants to.
Summing Up
While it is always sensible to investigate a company's debt, in this case Cipla has ₹39.3b in net cash and a decent-looking balance sheet. And we liked the look of last year's 46% year-on-year EBIT growth. So is Cipla's debt a risk? It doesn't seem so to us. Above most other metrics, we think its important to track how fast earnings per share is growing, if at all. If you've also come to that realization, you're in luck, because today you can view this interactive graph of Cipla's earnings per share history for free.
If, after all that, you're more interested in a fast growing company with a rock-solid balance sheet, then check out our list of net cash growth stocks without delay.
New: AI Stock Screener & Alerts
Our new AI Stock Screener scans the market every day to uncover opportunities.
• Dividend Powerhouses (3%+ Yield)
• Undervalued Small Caps with Insider Buying
• High growth Tech and AI Companies
Or build your own from over 50 metrics.
Have feedback on this article? Concerned about the content? Get in touch with us directly. Alternatively, email editorial-team (at) simplywallst.com.
This article by Simply Wall St is general in nature. We provide commentary based on historical data and analyst forecasts only using an unbiased methodology and our articles are not intended to be financial advice. It does not constitute a recommendation to buy or sell any stock, and does not take account of your objectives, or your financial situation. We aim to bring you long-term focused analysis driven by fundamental data. Note that our analysis may not factor in the latest price-sensitive company announcements or qualitative material. Simply Wall St has no position in any stocks mentioned.
About NSEI:CIPLA
Cipla
Engages in the manufacture, development, sale, and distribution of pharmaceutical products in India, the United States, South Africa, and internationally.
Flawless balance sheet with solid track record and pays a dividend.
Similar Companies
Market Insights


Advertisement
Community Narratives
Nike's Direct-to-Consumer Focus Will Drive Future Growth
Fair Value US$87.90|22.7% undervalued
UN
Community Contributor
Novo Nordisk will dominate GLP-1 market with Ozempic and Wegovy growth
Fair Value US$89.59|14.2% undervalued
BE
Community Contributor
Rheinmetall could get 20-25% of EU-NATO 3%-GDP defence spending
Fair Value €7.57k|82.8% undervalued
NO
Community Contributor