R K Swamy Limited's (NSE:RKSWAMY) Fundamentals Look Pretty Strong: Could The Market Be Wrong About The Stock?


R K Swamy (NSE:RKSWAMY) has had a rough three months with its share price down 12%. However, a closer look at its sound financials might cause you to think again. Given that fundamentals usually drive long-term market outcomes, the company is worth looking at. In this article, we decided to focus on R K Swamy's ROE.
Return on equity or ROE is a key measure used to assess how efficiently a company's management is utilizing the company's capital. In simpler terms, it measures the profitability of a company in relation to shareholder's equity.
See our latest analysis for R K Swamy
How Is ROE Calculated?
The formula for ROE is:
Return on Equity = Net Profit (from continuing operations) ÷ Shareholders' Equity
So, based on the above formula, the ROE for R K Swamy is:
17% = ₹414m ÷ ₹2.4b (Based on the trailing twelve months to June 2024).
The 'return' is the amount earned after tax over the last twelve months. One way to conceptualize this is that for each ₹1 of shareholders' capital it has, the company made ₹0.17 in profit.
Why Is ROE Important For Earnings Growth?
Thus far, we have learned that ROE measures how efficiently a company is generating its profits. Based on how much of its profits the company chooses to reinvest or "retain", we are then able to evaluate a company's future ability to generate profits. Assuming everything else remains unchanged, the higher the ROE and profit retention, the higher the growth rate of a company compared to companies that don't necessarily bear these characteristics.
R K Swamy's Earnings Growth And 17% ROE
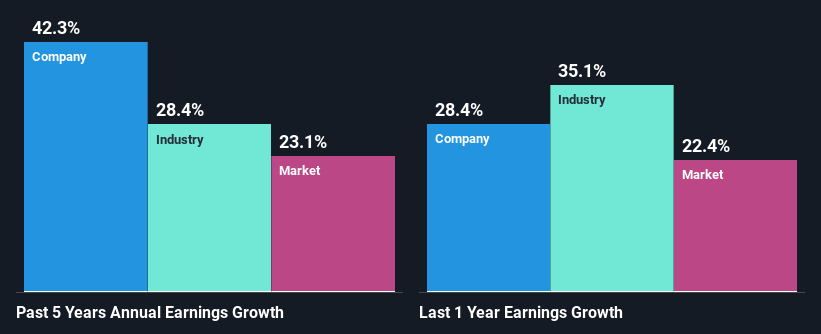
To start with, R K Swamy's ROE looks acceptable. Especially when compared to the industry average of 9.3% the company's ROE looks pretty impressive. Probably as a result of this, R K Swamy was able to see an impressive net income growth of 42% over the last five years. However, there could also be other causes behind this growth. Such as - high earnings retention or an efficient management in place.
Next, on comparing with the industry net income growth, we found that R K Swamy's growth is quite high when compared to the industry average growth of 28% in the same period, which is great to see.
Earnings growth is a huge factor in stock valuation. The investor should try to establish if the expected growth or decline in earnings, whichever the case may be, is priced in. This then helps them determine if the stock is placed for a bright or bleak future. If you're wondering about R K Swamy's's valuation, check out this gauge of its price-to-earnings ratio, as compared to its industry.
Is R K Swamy Using Its Retained Earnings Effectively?
R K Swamy's ' three-year median payout ratio is on the lower side at 12% implying that it is retaining a higher percentage (88%) of its profits. This suggests that the management is reinvesting most of the profits to grow the business as evidenced by the growth seen by the company.
Conclusion
Overall, we are quite pleased with R K Swamy's performance. Specifically, we like that the company is reinvesting a huge chunk of its profits at a high rate of return. This of course has caused the company to see substantial growth in its earnings. If the company continues to grow its earnings the way it has, that could have a positive impact on its share price given how earnings per share influence long-term share prices. Let's not forget, business risk is also one of the factors that affects the price of the stock. So this is also an important area that investors need to pay attention to before making a decision on any business. You can see the 1 risk we have identified for R K Swamy by visiting our risks dashboard for free on our platform here.
New: AI Stock Screener & Alerts
Our new AI Stock Screener scans the market every day to uncover opportunities.
• Dividend Powerhouses (3%+ Yield)
• Undervalued Small Caps with Insider Buying
• High growth Tech and AI Companies
Or build your own from over 50 metrics.
Have feedback on this article? Concerned about the content? Get in touch with us directly. Alternatively, email editorial-team (at) simplywallst.com.
This article by Simply Wall St is general in nature. We provide commentary based on historical data and analyst forecasts only using an unbiased methodology and our articles are not intended to be financial advice. It does not constitute a recommendation to buy or sell any stock, and does not take account of your objectives, or your financial situation. We aim to bring you long-term focused analysis driven by fundamental data. Note that our analysis may not factor in the latest price-sensitive company announcements or qualitative material. Simply Wall St has no position in any stocks mentioned.
About NSEI:RKSWAMY
R K Swamy
Provides integrated marketing services in India and internationally.
Excellent balance sheet second-rate dividend payer.
Similar Companies
Market Insights

Community Narratives
